In our podcast episode, CPABC's Aaron Aerts, economist, discusses with Vivian Tse, communications manager, some highlights from CPABC's recent BC-Checkup: Invest report. Part of our Coffee Chats with CPABC podcast series.
CPABC’s latest report highlights strong investment recovery across BC, but challenges remain
As previously highlighted in this magazine,1 BC’s investment climate worsened in 2020 due to the COVID-19 pandemic, with the number of active businesses, housing starts, and non-residential investments all declining considerably from the record-highs set in 2019.2 However, since the low point in the summer of 2020, BC has experienced one of the strongest economic recoveries in Canada.
As economic activity began to pick up in 2021 and investors gained greater certainty about the province’s ability to weather the strain of the pandemic, investment activity increased. In fact, several key investment indicators actually reached record levels in 2021, including the number of active businesses, the number of housing units started, and the amount of major project activity (underway and planned) across the province.
There are still challenges, however, as the COVID-19 pandemic has caused lasting damage to our economy. For example, investment in private non-residential construction remains far below the level set in 2019, and GDP per capita is not expected to fully recover until later in 2022. Further, the government’s many important support policies, combined with its reduced revenues, have driven up debt and increased pressure on government finances.
Here’s a closer look at some of the details.
Active businesses surpassed pre-pandemic levels
Given the number of business closures in 2020, the resultant decline in business activity and corresponding job losses were two of the clearest signs of the pandemic’s impact on BC’s economy. In fact, by May 2020, more than one in 10 businesses in BC (11.1%) had ceased operations, and the unemployment rate had reached 13.4%.
As business restrictions eased and economic activity picked up, those losses were recovered. In fact, the number of businesses increased in all but one of the 17 months between May 2020 and October 2021, for a total gain of nearly 20,000 businesses (see Figure 1), and by October 2021, there were 151,852 active businesses in BC, an increase of 2.2% over January 2020. This business growth supported significant employment gains across the province, with BC’s workforce numbering 2.7 million in October 2021, an increase of nearly 50,000 workers compared to January 2020.
Figure 1: Active Businesses and Employment in BC, January 2020-October 2021
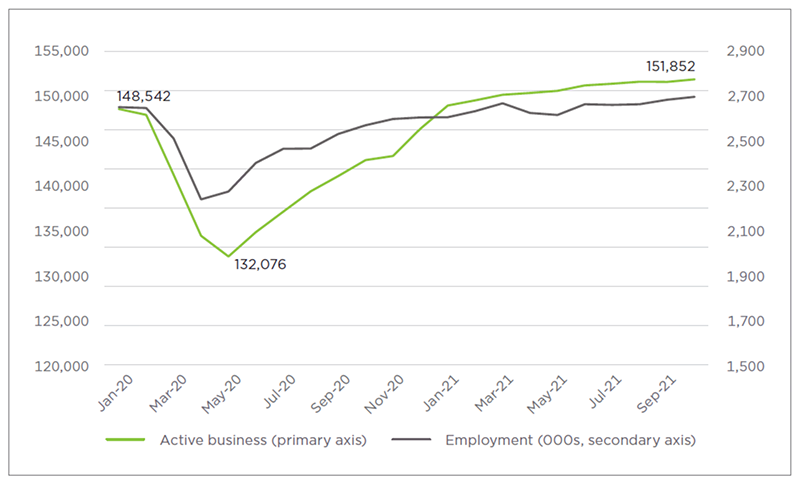
Source: Statistics Canada, Tables 33-10-0270-01 and 14-10-0287-01, seasonally adjusted.
Despite these improvements, however, business activity has varied, with some industries stagnating below pre-pandemic levels while others witnessed significant growth.
In particular, tourism and the arts, entertainment, and recreation sector suffered tremendously due to ongoing restrictions on customer-facing industries (see Table 1). The number of operational wholesale trade businesses also declined.
Table 1: Largest Active Business Decrease: January 2020 to October 2021
| Tourism | -2.2% |
| Wholesale trade | -2.0% |
| Arts, entertainment, and recreation | -0.7% |
Source: Statistics Canada, Table 33-10-0270-01, seasonally adjusted. Captures industries with 500 or more active businesses.
By contrast, the media-creation industry (i.e., information and culture) led the pack for growth in BC. In addition to benefiting from high levels of media production since the latter half of 2020, the industry continued to expand as travel restrictions between Canada and the USA loosened3 (see Table 2). The professional, scientific, and technical service industry also saw strong business growth, as did the food manufacturing industry.
Table 2: Largest Active Business Increase: January 2020 to October 2021
| Information and culture | +10.0% |
| Professional, scientific, and technical services | +7.8% |
| Food manufacturing | +6.3% |
Source: Statistics Canada, Table 33-10-0270-01, seasonally adjusted. Captures industries with 500 or more active businesses.
BC saw record-breaking housing starts in 2021
Given the significant price escalation of residential real estate in BC and the provincial government’s strong desire to increase supply, another positive investment trend was the rise in the number of housing units started across the province.4 In fact, BC set a new record in 2021 with 43,360 total housing units beginning construction, slightly above the previous high set in 2019 and 24.3% higher than the number in 2020 (see Figure 2).
Figure 2: Housing Units Started in British Columbia, 2018-2021
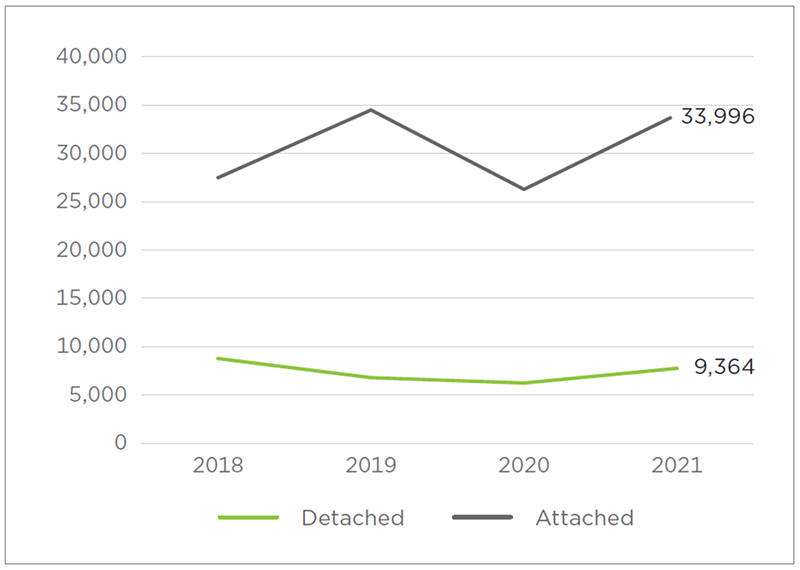
Source: Canada Mortgage and Housing Corporation, Housing Starts, Completions and Units under Construction, accessed January 28, 2022.
This growth primarily resulted from a large increase in the number of attached units, such as condos and townhomes, which had faced a steep decline in 2020. Attached units accounted for 78.4% of all units started in 2021. (More recently, demand has been strongest for larger units, so it will be interesting to see how residential real estate investments shift in the coming years.)
Private non-residential investment declined
While residential investment improved in 2021, the same cannot be said for private non-residential investment, which decreased to $4.0 billion between January and November 2021. This represented a loss of $2.3 billion compared to the same period in 2019 and a loss of $609.3 million compared to 2020 (see Table 3).
Commercial projects were hardest hit, although industrial projects also struggled to find private investors. It’s important to note, however, that private investment in both commercial and industrial projects remained well above the levels set in 2016.
Table 3: Non-Residential Investment in BC
| Value in 2021* | Since 2016 | Since 2019 | Since 2020 | |
| Total private sector | $4,043,072,923 | 13.3% | -36.2% | -13.1% |
| Industrial | $686,869,870 | 17.2% | -30.4% | -7.5% |
| Commercial | $3,356,203,053 | 12.5% | -37.3% | -14.2% |
| Institutional and government | $1,581,152,815 | 35.6% | -10.3% | 12.2% |
| Total private and public sector | $5,624,225,738 | 18.8% | -30.6% | -7.2% |
Source: Statistics Canada, Table 34-10-0175-01. Seasonally adjusted and adjusted for inflation.
*January to November 2021; compared to same period in prior years.
Interestingly, institutional and government investment was more resilient in 2021. While down compared to 2019, public investment was 12.2% higher than in 2020 and 35.6% higher than in 2016. This strength in public investment is why major project activity has continued to grow despite the ongoing challenges of the COVID-19 pandemic.
Investment in major projects boosted economic activity
Major projects—those with a capital cost of $15 million or higher—are also cause for optimism. Driven by natural resource and infrastructure projects, BC’s inventory of major projects increased to $393.4 billion in Q3 2021, a 6.4% increase over the previous year (see Table 4).
Table 4: Major Project Inventory by Development Region, Q3 2021
| Estimated cost of major projects ($ million) | One-year change | |
| British Columbia | $393,408 | 6.4% |
| Southwest BC | $101,386 | 20.0% |
| Northeast BC | $45,233 | 12.1% |
| Cariboo | $16,782 | 9.8% |
| Northwest BC* | $173,539 | 1.0% |
| Vancouver Island/Coast | $30,702 | -0.5% |
| Thompson-Okanagan | $18,935 | -2.6% |
| Kootenay | $6,831 | -10.2% |
Source: Ministry of Advanced Education and Skills Training, British Columbia Major Project Inventory: Third Quarter 2021.
*Northwest BC consists of the Nechako and North Coast development regions. Data for these two regions has been combined here.
About a third of these major projects are now under construction, and the three largest are the LNG Canada Facility ($36.0 billion), the Site C Project ($16.0 billion), and the Coastal GasLink Pipeline Project ($6.2 billion). As of Q3 2021, the largest projects that have come online are the Lougheed Town Centre ($7.0 billion), the Broadway Subway Project ($2.8 billion), and the St. Paul’s Hospital Replacement ($2.2 billion).
The economic activity these projects have brought to every region of the province has been a prime driver of our robust economic recovery. This is good news given the significant economic downturn of the 2020 recession. Real GDP per capita fell by 4.6% in 2020, and it is not expected to exceed pre-pandemic levels until 2022 (see Table 5).
Table 5: Real GDP per Capita in BC
| 2019 | $53,983 |
| 2020 | $51,518 (-4.6%) |
| 2021F | $53,623 (+4.1%) |
| 2022F | $55,136 (+2.8%) |
Sources: BC Stats, Population Estimates & Projections for British Columbia; and Statistics Canada, Table 36-10-0222-01. F = forecast, based on the average of the five largest banks’ forecasts, per CPABC’s Economic Dashboard as of January 14, 2022.
BC government debt-to-GDP expected to jump
As mentioned earlier, the fiscal support programs launched by both the provincial and federal governments to address the pandemic, coupled with depressed revenues from lower economic activity, have significantly damaged both governments’ financial positions. In BC, for example, the net debt-to-GDP ratio increased by five percentage points in just one year, rising from 15.0% in FY2019/20 to 20.0% in FY 2020/21—an increase that represented an additional $2,508 of net debt per capita.5
It’s worth noting, however, that the 2022 BC budget had not been tabled by the time of this writing in early February, so up-to-date forecasts on debt trends over the short-term were not yet available. Still, while we anticipate an improvement over the outlook provided in the 2021 BC budget, the provincial government’s fiscal situation remains considerably weaker than prior to the pandemic.
Concerns about BC’s worsened fiscal situation were captured in our recent BC Check-Up: Invest survey, with 93% of CPA respondents saying the need for a plan to return to fiscal balance in the medium-term (i.e., five to seven years) is important (see Figure 3).
Figure 3: CPAs on Importance of Medium-Term Fiscal Recovery Plan
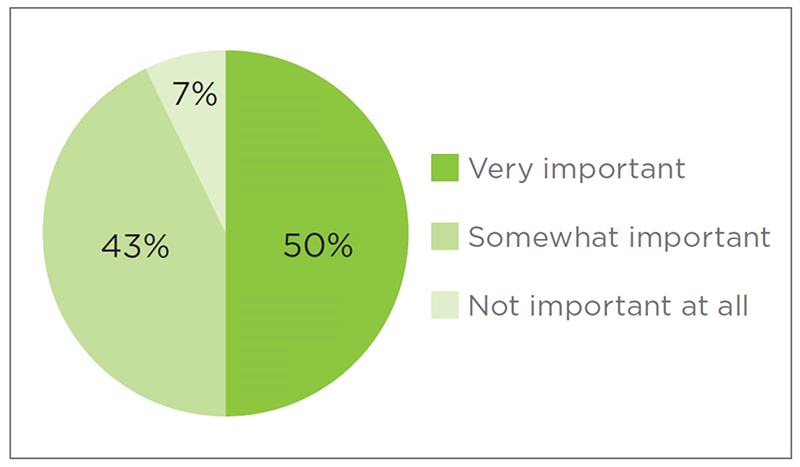
Source: CPABC, BC Check-Up: Invest survey, December 8-29, 2021. N=908.
CPAs are optimistic but say more incentives to invest are needed
The BC Check-Up: Invest report indicates many reasons to be optimistic about British Columbia’s economic climate, including robust housing and business activity and major project investments. However, there are clear signs of uneven economic recovery and lasting damage. Given the significant increase in government debt and the 2020 recession’s continued impact on GDP levels in this province, we will need to create an environment that attracts more capital if we want to boost business productivity.
Responding to our recent BC Check-Up: Invest survey, CPAs said the top policy priorities to accomplish this are working with other levels of governments to improve the housing supply, increasing investments in infrastructure projects, and offering additional skills training to BC workers (see Figure 4; for more survey data, see the March/April 2022 issue of CPABC in Focus).
Figure 4: CPAs on Policy Priorities for Long-Term Recovery
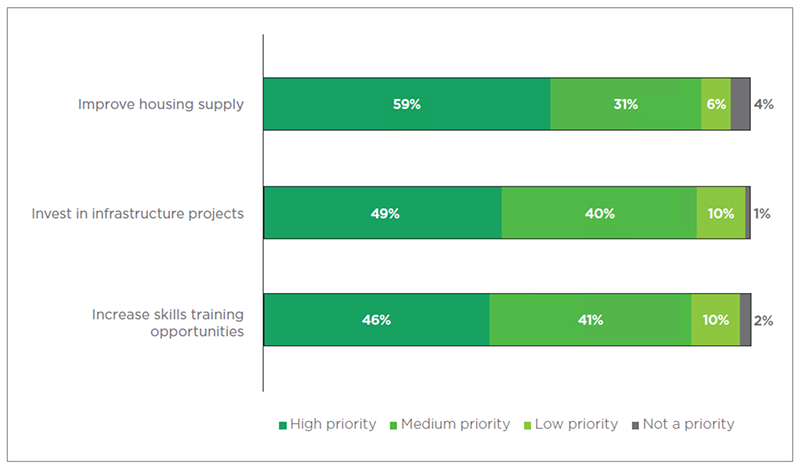
Source: CPABC, BC Check-Up: Invest survey, December 8-29, 2021. N=908. Percentages may not sum to 100% due to rounding.
Going forward, CPABC will advance these ideas to government as part of a strategy to attract greater capital investment and improve the province’s economic outlook.
Aaron Aerts is CPABC’s economist. This article was originally published in the March/April 2022 issue of CPABC in Focus.


