
CPABC recently launched its second report of 2021 and the third in its triannual series on the way British Columbians work, invest, and live.1BC Check-Up: Live focuses on the impact of travel restrictions during the COVID-19 pandemic—specifically, how these restrictions affected migration patterns and stunted BC’s previously rapid population growth. The report also examines demographic trends, including how the average age of British Columbians continues to rise. Finally, it assesses housing affordability, highlighting the surging cost of residential real estate, the lag in housing supply, and the increasing disparity between family income and housing prices.
Population growth slowed as the pandemic took its toll on immigration
Between 2017 and 2019, BC set record levels of annual population growth, with an average influx of more than 77,000 new residents a year. This growth was primarily due to the arrival of an increasingly large number of international immigrants, with a fairly even split between non-permanent residents and permanent residents. In fact, BC’s population surpassed five million for the first time in 2018, up by more than 500,000 new residents compared to 2011.2
In 2019, the net number of international immigrants to the province exceeded 62,000 new residents, making up nearly 80% of the total population gain that year (see Figure 1). This trend of rapid growth was expected to continue in 2020, particularly as the federal government had set a target of welcoming a record 341,000 new permanent residents to offset Canada’s aging population and slowing natural growth rate.
Unfortunately, like many other carefully planned policy objectives, these efforts were disrupted in early 2020 when the COVID-19 pandemic led to travel restrictions and economic uncertainty around the globe. The normal flow of international immigration slowed considerably and, as a result, Canada reached just over half of its 2020 target for new permanent residents across the country.3
Conversely, BC actually saw a modest increase in net interprovincial and international permanent resident immigration. However, we also saw a significant decline in the number of incoming non-permanent residents, as international students and temporary workers were particularly affected by travel restrictions and the closure of in-person educational facilities. In total, BC saw a net outflow of 858 non-permanent residents in 2020, a significant decline from the net gain of 29,490 non-permanent residents in 2019 (see Figure 1).
So while BC took less of a hit than other Canadian jurisdictions in terms of population growth in 2020, the province’s overall gain of 56,757 new residents from all sources was still its lowest overall gain since 2011 and only approximately two-thirds of what we experienced in 2019.
Figure 1: Annual Population Change in BC by Type, 2017-2020
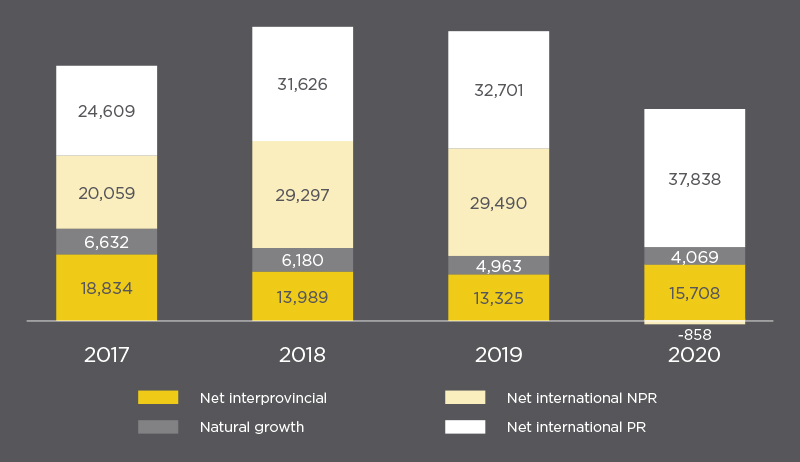
Source: Statistics Canada, Table 17-10-0140-01.
The good news is that the dip in population growth in 2020 is believed to be a one-off decline attributable to the COVID-19 pandemic, and strong population gains are anticipated for both BC and Canada in 2021 and onward. At the same time, however, BC’s population growth is expected to become increasingly reliant on interprovincial and international immigration, as our population continues to age and our rate of natural growth continues to fall.
BC’s natural growth rate continues to decline
The rate of natural growth—the number of births minus the number of deaths—has been declining in most Canadian jurisdictions in recent years, and BC is no exception.4 In fact, a significant slowdown has been underway in this province since 2010.
In 2020, natural growth accounted for only 4,069 new residents—BC’s lowest gain in at least 50 years and less than a third of the number set in 2010 (see Figure 2).5 This decline is forecast to continue, and it’s expected that annual deaths will eventually outnumber births, pushing the natural growth rate into negative numbers.6
Figure 2: BC Natural Growth, 2002-2020
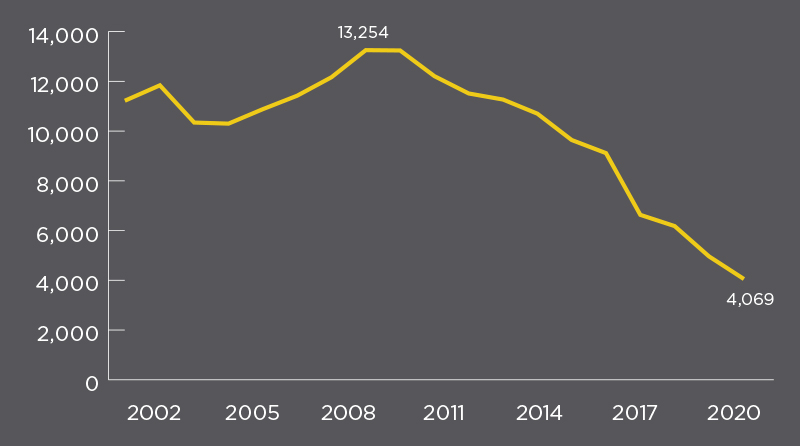
Source: Statistics Canada, Table 17-10-0140-01.
Although this pattern of declining natural growth is consistent across the province, the situation varies considerably region to region. Three development regions—Southwest BC, Northeast BC, and Northwest BC—are still seeing positive natural growth, while the rest of the province is already in the negative range (see Table 1). Between 2011 and 2020, the Vancouver Island/Coast and Thompson-Okanagan development regions experienced the biggest declines in natural growth. Driving these declines is the fact that Victoria and Kelowna have the first- and second-lowest birth rates in the entire country, respectively.7
Table 1: Natural Annual Population Growth by BC Development Region, 2011-2020
| Region | 2011 | 2016 | 2020 | Net Change 2011 to 2020 |
|---|---|---|---|---|
| British Columbia | 12,209 | 9,114 | 4,069 | -8,140 |
| Vancouver Island/Coast | -521 | -1,198 | -2,406 | -1,885 |
| Thompson-Okanagan | -326 | -799 | -1,721 | -1,395 |
| Kootenay | -21 | -208 | -455 | -434 |
| Cariboo | 586 | 239 | -90 | -676 |
| Northwest BC* | 509 | 392 | 231 | 278 |
| Northeast BC | 646 | 685 | 508 | -138 |
| Southwest BC | 11,336 | 10,003 | 8,002 | -3,334 |
Source: Statistics Canada, Table 17-10-0140-01.
*Northwest BC consists of the Nechako and North Coast development regions. Data for these two regions has been combined here.
BC’s population continues to age, but there are big regional differences
The population is getting older across Canada, including in BC. And while this trend is not at all new—the average age in Canada has been increasing since at least 1971—it has been picking up speed over the past 20 years.8
Figure 3: Average Age in BC and Canada, 2000-2020
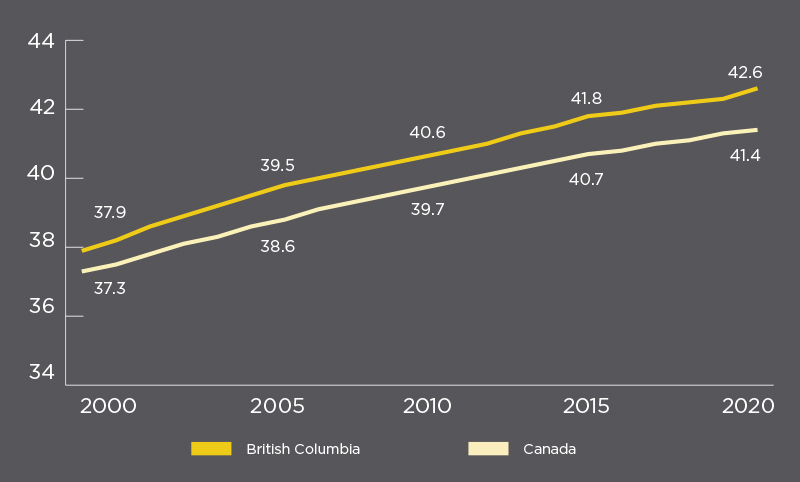
Source: Statistics Canada, Table 17-10-0005-01.
As with population growth, the changes here have been driven, in large part, by BC’s declining birth rate and the large number of aging baby boomers. Notably, the percentage of British Columbians aged 65 and over has increased more than any other age group over the past five years and accounted for nearly a fifth of BC’s population in 2020 (see Figure 4).
Figure 4: BC Population Distribution by Age, 2020 (change from 2016)
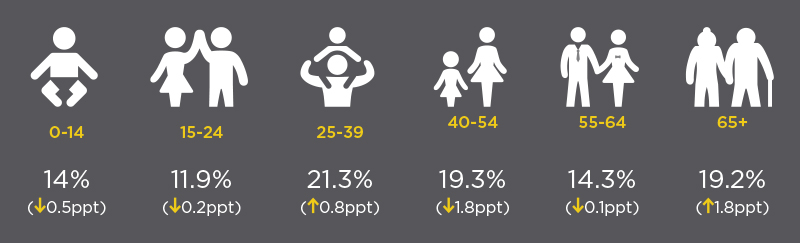
Source: Statistics Canada, Table 17-10-0137-01.
Millennials (those aged 25-39) were the only other group to see positive growth over the same period, and they now make up the largest percentage of BC’s population, at 21.3%. By contrast, the two youngest age categories continued to decline as percentages of the total population, with those 24 and under making up just 25.9% of the population in 2020 compared to 31.2% in 2001.
Although every region has seen an increase in average age over the past five years, the average age varies significantly across the province (see Figure 5). Overall, Northeast BC has the youngest population, with an average age of just 36.6, while Vancouver Island/Coast is home to the oldest population, with an average age of 45.7.
Figure 5: BC Average Age by Development Region (change from 2016)
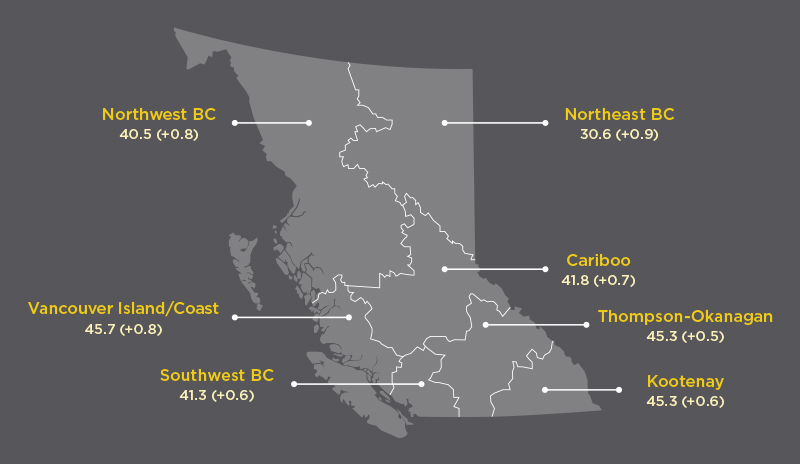
Source: Statistics Canada, Table 17-10-0137-01.
We could moderate the rising average age of our current population by attracting younger immigrants to the province and encouraging more British Columbians to start families, but we face a huge barrier in the record-high price of residential real estate across the province. While housing price increases have been driven by record levels of demand and low interest rates, prices have also been rising because supply hasn’t kept up with demand.
Housing supply lags behind population growth
Many housing developments have been started and completed in BC over the past decade, but supply increases simply haven’t kept up with the pace of population growth. Cumulatively, BC’s population increased by more than 737,000 residents between 2010 and 2020, but only 316,510 residential housing units in total were completed over the same period—a rate considerably lower than one new unit per two new residents.
The slowdown in population growth during the pandemic helped to narrow the gap with new housing supply in 2020. Nearly 39,000 housing units were completed last year, amounting to a rate of approximately 0.7 units per new resident (see Figure 6). This was well above the recent low of 0.3 units per new resident in 2016 and the rate of 0.5 units in 2019. However, the gap between housing demand and housing supply is expected to widen again as population gains return to pre-pandemic levels.
Figure 6: Population Growth versus Housing Units Completed, 2016-2020
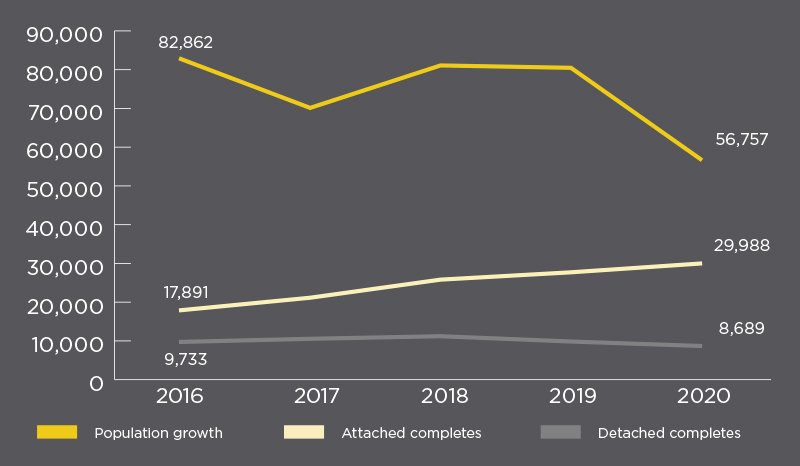
Sources: Statistics Canada, Table 17-10-0140-01 and Canada Mortgage and Housing Corporation, Housing Market Data.
There are two additional challenges to consider: We’re not building enough larger, detached units, and many of the new builds are replacing older stock.
Increasingly over the 20 years, the housing units developed in BC have been smaller, attached units such as condos, apartments, and townhomes. In fact, 77.5% of the new supply in 2020 consisted of attached units—a sharp increase from 58.4% in 2011 and 64.8% in 2016. Further, these attached units—particularly condos—have gotten smaller in recent years, making them increasingly unsuitable for families.9 So while an increase in the number of attached units completed is encouraging, the correlative downtrend in detached units is problematic.
Moreover, focusing solely on the total number of housing units completed overlooks the fact that many of these units have replaced previously existing housing stock. For example, as urban centres like Metro Vancouver, Kelowna, and Victoria continue to densify, more and more old housing stock is being replaced with larger developments. And although the result is a net increase in housing supply, the above completion data overstates the increase because it doesn’t reflect the loss of the previous units.
Even amid the COVID-19 pandemic, housing prices continue to soar
After years of rapid growth, BC’s real estate prices began to stabilize in the years directly preceding the COVID-19 pandemic. However, that trend quickly reversed in the latter half of 2020 as more homebuyers—many working from home—sought additional living space and set their sights on larger, detached homes.
This surge in demand coupled with record-low interest rates increased the number of residential home sales significantly. In fact, in March 2021, home sales in both BC and Canada reached the highest levels ever recorded.[10] This led to new record-breaking prices for housing across much of the country, including BC. In fact, by April 2021, the average price of houses sold in BC was $943,845, up by over $200,000 from the average in April 2020 (see Figure 7). This dramatic increase was driven, in large part, by a surging demand for detached units, which are typically more expensive.
Figure 7: Average Price of Houses Sold in BC, 2016-2021
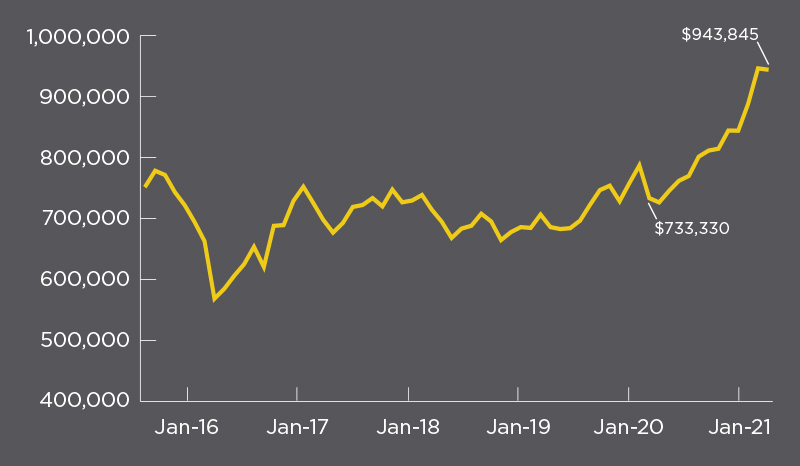
Source: Canadian Real Estate Association. Based on the average price of houses sold in BC each month.
The rapid escalation in prices—particularly for larger detached homes—affected every part of the province, as many would-be buyers found themselves priced out of the Metro Vancouver market (see Table 2).11
Table 2: Benchmark Price of Residential Real Estate Sold in April 2021
| Housing Type | Vancouver Island | Lower Mainland | Okanagan Valley | Greater Victoria |
|---|---|---|---|---|
| Single family home | $661,100 | $1,565,300 | $756,200 | $894,700 |
| % change from April 2020 | 22.2% | 24.9% | 29.4% | 15.8% |
| Apartment | $343,800 | $694,200 | $407,000 | $533,100 |
| % change from April 2020 | 13.6% | 6.6% | 12.6% | 3.7% |
Source: Canadian Real Estate Association, MLS® Home Price Index.
Concerned about the unintended consequences of ballooning housing prices across Canada—including a reduction in entrepreneurship due to rising consumer debt—several prominent institutions, including the big banks,12 have urged the federal government to introduce measures to cool the hot housing market.13
BC rental rates have increased by more than 25% over the past five years
Like homeowners, renters are also dealing with a significant uptick in costs. Despite a provincial order restricting rent increases for tenants in both 2020 and 2021, prices for rental units—particularly larger units—jumped significantly across BC in 2020.14 The average rental price for a three+-bedroom unit in BC was $1,691 a month in 2020, up 11.2% from 2019 and 27.5% from 2016, while the average rental price for a one-bedroom unit was $1,260 a month, up 5.9% from 2019 and 27.9% from 2016 (see Figure 8). And while rental rates are highest in Greater Vancouver—where the average three-bedroom unit cost $2,063 a month in 2020—prices are rising dramatically in every region in the province.
Figure 8: Average Rental and Vacancy Rates, 2016-2020
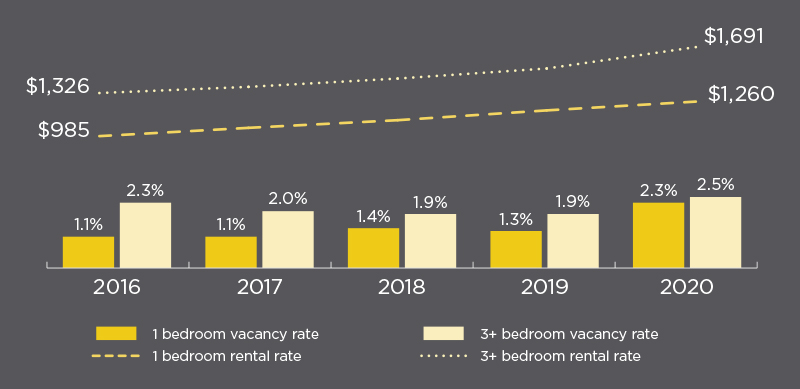
Source: Canada Mortgage and Housing Corporation, Rental Market Survey.
Median income has not kept pace with rising costs
In 2019, BC families earned a median income of $90,100, up 3.6% from 2016, while single individuals earned a median income of $32,200, up 7.0% from 2016.15 Not only is the growth in median incomes (especially for families) considerably lower than the increase in housing prices—it also lags behind overall inflation, which increased by 7.4% between 2016 and 2019.16
And while no income data for 2020 is available at the time of this writing in early June, it’s reasonable to assume that the recession stemming from the COVID-19 pandemic has put additional downward pressure on incomes. Canadian GDP, adjusted for inflation, fell by a staggering 5.4% in 2020, and while it’s true that the country is currently experiencing a robust economic recovery, GDP levels are not expected to return to pre-pandemic levels until late 2021 or early 2022.17
In addition, provincial and federal governments incurred significant debt to support Canadians through the pandemic, and this will limit their ability to provide additional income supports or reduce taxes going forward.
Looking ahead: Attracting immigrants should be a key focus
Although population growth slowed in 2020, BC sits in a relatively good position because its ability to attract both interprovincial and international migrants has led to robust growth over the past decade. Still, as growth from within the province continues to decline, it will be increasingly important to attract new workers—particularly younger ones—to BC.
For example, the provincial and federal governments should expand measures that provide young international students with a pathway to permanent residency, such as the two new immigration streams introduced in June for Hong Kong residents who have recently graduated from a post-secondary institution in BC.18
At the same time, the province needs to address the rapid escalation of housing prices, which has been exacerbated by a slower-than-necessary growth in housing supply. Exorbitant prices are a key barrier for immigrants, out-of-province migrants, and locals alike.
Going forward, governments at all levels should work with the private and non-profit sectors to find ways to expedite housing supply growth. It will also be important to ensure that future housing developments match the type of housing demanded and that there’s an adequate supply of rental and subsidized housing available for those priced out of home ownership. This is especially important because growth in family income has lagged behind housing price increases over the past several years, making already significant affordability challenges worse.
Lastly, as we look to BC’s economic recovery, there is an opportunity to consider ways to improve our economic outlook and growth. For example, the employment disruption resulting from the COVID-19 pandemic provides an opportunity to reskill displaced workers and pivot them toward emerging industries, particularly ones that can boost their income and our province’s productivity.
Aaron Aerts is CPABC’s economist.
This article, along with highlights from the BC Check-Up: Live survey, originally appeared in the July/August 2021 issue of CPABC in Focus.


