CPABC recently launched its BC Check-Up: Live report, the second in its triannual series on investing, living, and working in British Columbia. The latest iteration of BC Check-Up: Live focuses on COVID-19’s impact on migration patterns—specifically, how travel restrictions and economic uncertainty continued to curtail BC’s population growth in 2021. The report also examines demographic and housing affordability trends.
Decade-low population growth
As noted in the July/August 2021 issue of the magazine,1 British Columbia experienced a spike in population growth in the lead-up to the COVID-19 pandemic. In fact, between July 1, 2018, and July 1, 2019, the province welcomed more than 84,000 new residents—the largest annual population increase on record.2 This growth was primarily due to the arrival of international immigrants, who accounted for approximately three-quarters of BC’s population increase in 2019.3
The COVID-19 pandemic put this trend on hold in 2020 as it disrupted migration patterns around the world. Population growth in BC fell to 63,932 new residents in 2020 and dropped to 55,884 between July 1, 2020, and July 1, 2021—the lowest annual gain since 2011.4
These declines were primarily due to a continued slowdown in the number of international immigrants coming to the province. Specifically, the number of international non-permanent residents (NPRs), such as students and temporary workers, began to drop in 2020. Prior to the pandemic, NPR immigration had been an increasing source of population growth, with BC seeing a net gain of more than 29,000 NPRs in 2019 alone; by contrast, there was a net outflow of more than 7,000 NPRs in 2021 (as indicated in Figure 1, international permanent resident (PR) immigration was much more resilient).
Figure 1: Annual Population Change in BC by Type, 2017-2021
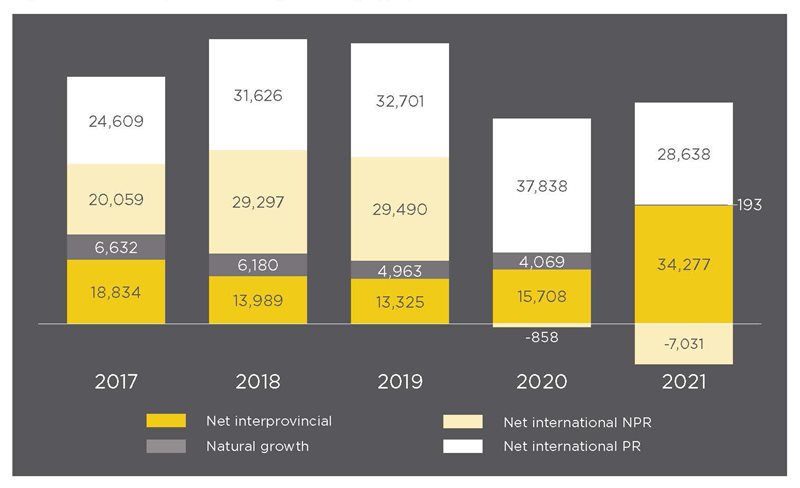
Source: Statistics Canada, Table 17-10-0140-01.
The arrival of a growing number of residents from other provinces helped offset the downward trend in international immigration. In total, BC welcomed a net gain of more than 34,000 new residents from other provinces in 2021—nearly three times its annual average of 11,700 between 2011 and 2021.5 Further, 2021 marked the first time in 10 years that net interprovincial migration contributed much more significantly to population growth than net international immigration (+21,607 residents).
Still, the overall slowdown in population growth in 2020 and the first half of 2021 remains a challenge, as the province has a long-term goal of attracting immigrants to help offset its aging demographics and fill the rising number of job vacancies. BC’s job vacancy rate hit a record of 6.8% in the third quarter of 2021 before dropping to 6.1%—nearly 149,000 jobs—in the fourth quarter of 2021. By comparison, the previous high was 4.8%, reached in the third quarter of 2018.6
Fortunately, the dip in population growth in 2020 and early 2021 is believed to be a short-term phenomenon attributable to the pandemic, and strong population gains are anticipated for both BC and Canada from 2022 onward. The latter half of 2021 lent credence to this optimism, with British Columbia experiencing a significant uptick in population growth as economic activity, migration, and immigration began to bounce back. The provincial government is now projecting a return to population gains of approximately 71,700 new residents per year between 2022 to 20277—slightly above BC’s average annual population gain of nearly 70,000 between 2011 and 2019.8
Declining natural growth
Like almost every country measured by the Organisation for Economic Co-operation and Development, Canada has seen a gradual decline in its natural growth rate (the number of births minus the number of deaths).9 This is certainly the case in BC, where a significant slowdown has been underway since 2010.
In 2021, natural growth accounted for only 169 new residents—BC’s lowest gain on record and just a small fraction of the gain of 13,254 new residents in 2009 (see Figure 2).10 Although some of the decline in 2020 and 2021 can be attributed to the tragic loss of life caused by COVID-19, BC’s natural growth rate is expected to continue declining after the pandemic is over. In fact, it’s expected that annual deaths will soon outnumber annual births in this province, making the term “natural growth rate” a misnomer.11 Based on the current trajectory, this shift from positive to negative natural growth could happen as early as the latter half of 2022.
Figure 2: BC Natural Growth, 1990-2021
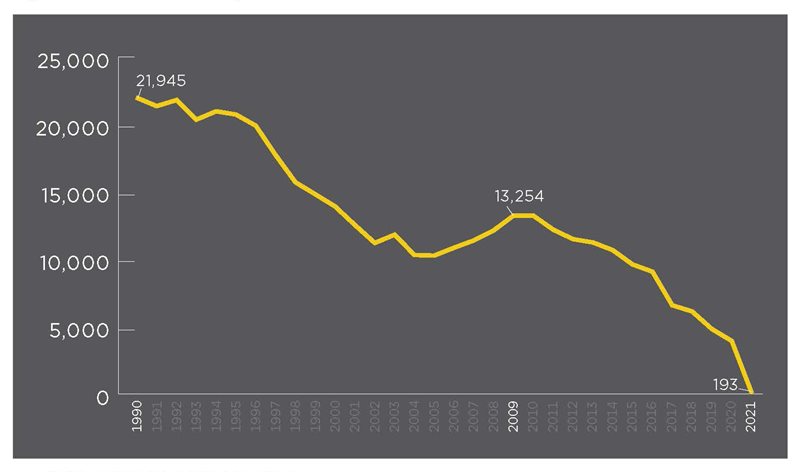
Source: Statistics Canada, Table 17-10-0140-01.
Although this pattern of declining natural growth was consistent across the province in 2021, the situation varied widely between regions. The Southwest BC, Northeast BC, and Northwest BC development regions saw positive—albeit minimal—natural growth, while the rest of the province entered the negative range (see Table 1). Between 2011 and 2021, the Southwest BC, Vancouver Island/Coast and Thompson-Okanagan development regions experienced the biggest absolute declines in natural growth. Low fertility rates were likely a primary driver of these declines, as four BC regions had the lowest fertility rates in Canada in 2020 (Victoria ranked lowest, Nanaimo second lowest, Vancouver third lowest, and Kelowna sixth lowest).12
Table 1: Natural Annual Population Growth by BC Development Region, 2011-2021
| Region | 2011 | 2016 | 2021 | Net Change 2011 to 2021 |
|---|---|---|---|---|
| British Columbia | 12,209 | 9,114 | 193 | (12,016) |
| Vancouver Island/Coast | (521) | (1,198) | (3,524) | (3,003) |
| Thompson-Okanagan | (326) | (799) | (2,229) | (1,903) |
| Kootenay | (21) | (208) | (601) | (580) |
| Cariboo | 586 | 239 | (60) | (646) |
| Northwest BC* | 509 | 392 | 162 | (347) |
| Northeast BC | 646 | 685 | 489 | (157) |
| Southwest BC | 11,336 | 10,003 | 5,956 | (5,380) |
Source: Statistics Canada, Table 17-10-0140-01.
*Northwest BC consists of the Nechako and North Coast development regions. Data for these two regions has been combined here.
Accelerated age growth
While the average age in Canada has been increasing since at least 1971,13 the pace of this trend has accelerated over the past two decades. During that time, British Columbia’s age growth rate consistently exceeded the national average (see Figure 3).
Figure 3: Average Age in BC and Canada, 2001-2021
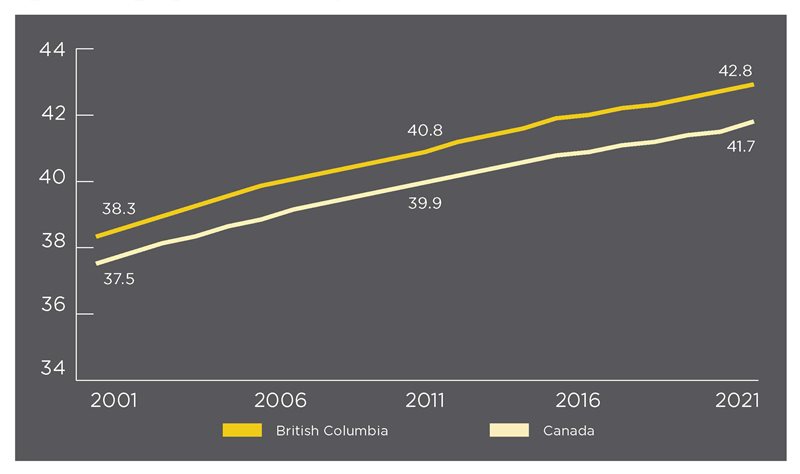
Source: Statistics Canada, Table 17-10-0005-01.
As with population growth, the changes here have been driven, in large part, by the declining birth rate and the large percentage of British Columbians aged 65 and over. Notably, this age group has increased more than any other over the past five years, accounting for 19.7% of BC’s population in 2021 compared to 15.3% in 2011 (see Figure 4).
Figure 4: BC Population Distribution by Age, 2021 (change from 2011)

Source: Statistics Canada, Table 17-10-0137-01.
British Columbians aged 25-39 and 55-64 were the only other groups to increase between 2011 and 2021. Those in the 40-54 age range dropped from 22.9% to 19.3% over that same period, while those under 24 dropped from 28.1% to 25.3%.
As was the case with natural growth, the average age varied significantly across the province (see Figure 5). Overall, Northeast BC had the youngest population in 2021, with an average age of 36.9, while Vancouver Island/Coast was home to the oldest population, with an average age of 45.9.
Figure 5: BC Average Age by Development Region (Change from 2011)
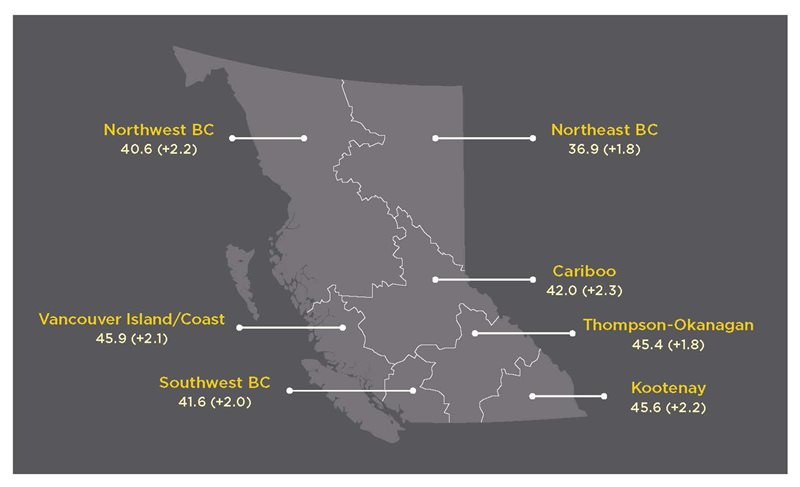
Source: Statistics Canada, Table 17-10-0137-01.
The aging of BC’s population over the coming decades is expected to put additional upward pressure on our labour force as older British Columbians not only leave the workforce but also require additional resources from our health and social care systems. Attracting younger immigrants to the province and encouraging more British Columbians to start families could help to curb the age growth rate; however, record-level real estate prices continue to create a significant disincentive both for current residents and potential immigrants.
Soaring home prices
While price increases were highest in the Lower Mainland in the early 2010s, all of BC’s major population centres have seen rapid price escalation since 2015 and 2016.
Strong demand, especially for larger spaces such as detached units, along with record-low interest rates pushed prices to increasing highs throughout the COVID-19 pandemic (see Figure 6). As a result, the average price of homes sold in BC in April 2022 was $1.04 million—up by 12.1% from April 2021 and by a staggering 45.2% from April 2020.
Figure 6: BC Home Price Index for Select Regions, April 2010-2022
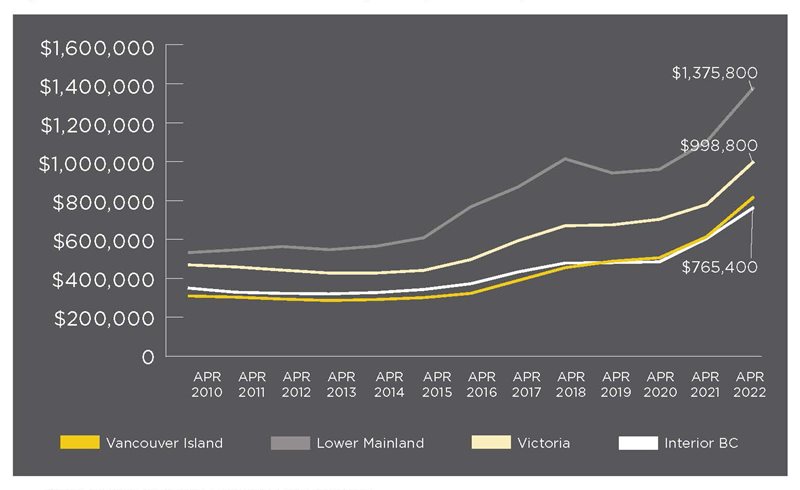
Source: Canadian Real Estate Association, Home Price Index.
Concerned about the unintended consequences of ballooning housing prices across Canada—including a reduction in entrepreneurship due to rising consumer debt—several prominent institutions14 urged the federal government to introduce measures to cool the hot housing market in 2021.15
Additionally, the Bank of Canada began to rapidly increase interest rates in the spring of 2022, and will likely continue to do so to help combat rising inflationary pressures.16 This has helped cool national housing prices in the first half of 2022 and could help to moderate housing prices in the latter half of the year and in 2023.17 However, inadequate growth in the housing supply over the past decade greatly limits access to affordable housing in this province.
A significant housing supply gap
The slowdown in population growth during the pandemic helped narrow the gap with new housing supply in 2021. Over 39,000 housing units were completed last year, amounting to a ratio of approximately 0.7 units per new resident (see Figure 7). This was well above the recent low of 0.3 units per new resident in 2016 and the ratio of 0.5 units in 2019.
Figure 7: Population Growth versus Housing Units Completed, 2010-2021
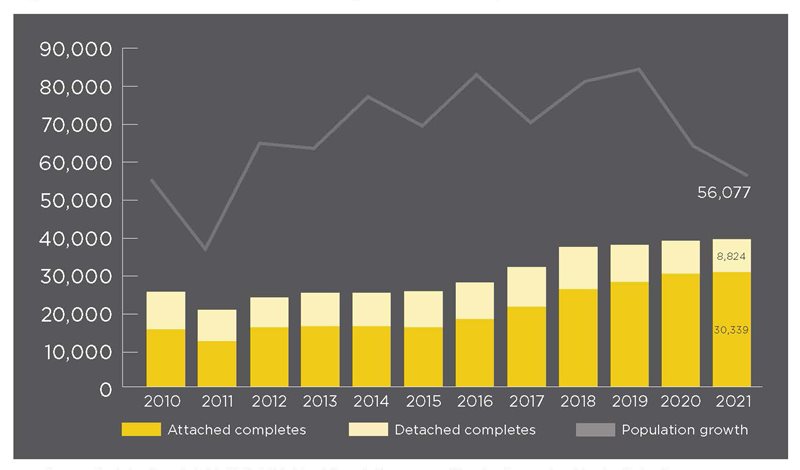
Sources: Statistics Canada, Table 17-10-0140-01 and Canada Mortgage and Housing Corporation, Housing Market Data
However, the gap between housing demand and housing supply is expected to widen again as population gains return to (or exceed) pre-pandemic levels.
Adding to the challenge is the fact that BC has experienced a supply-demand mismatch for more than a decade. BC saw its population increase by 804,299 residents between 2010 and 2021, and only 355,673 housing units were completed across the province during that same period. And while the number of housing completions has increased since 2015, the units in question have typically been smaller, attached homes such as condos and apartments.
In fact, 77.5% of the units completed in BC in 2021 were attached, compared to 59.8% in 2010. Further, these attached units—particularly condos—have gotten smaller in recent years, making them increasingly unsuitable for families.18 At the same time, mid-sized housing units have seen the strongest demand, and yet these units are becoming increasingly rare.
Moreover, many of the newly completed units have replaced existing housing stock. For example, as urban centres like Metro Vancouver, Kelowna, and Victoria continue to densify, old housing stock is being replaced with larger developments. While the outcome is a net gain in housing supply, the above completion data doesn’t tell the full story—in fact, it overstates the increase because it doesn’t reflect displaced housing units.
Finally, as noted in a recent report from the Canada Mortgage and Housing Corporation, Metro Vancouver continues to have a significant supply gap even after a decade of significant housing construction.19 And while some municipalities in the Metro Vancouver area have sought innovative ways to expand the supply of housing—by allowing for secondary suites and laneway homes, for example—these efforts are unlikely to improve housing affordability in a material way. As the report indicates, significantly more supply needs to become available to achieve the goal of making housing more affordable in Metro Vancouver and across the province.20
A challenging rental market
A significant underinvestment in purpose-built rental units in BC has resulted in significant upward pressure on rental prices and vacancy rates (see Figure 8). Between 2010 and 2021, the average rental price in Metro Vancouver increased by 52.8%, compared to an overall growth of 19.6% in the consumer price index. Units with three bedrooms or more saw the biggest hike over this period, with prices increasing by 65.0%.
Vacancy rates also declined significantly between 2010 and 2021. And despite a provincial freeze on rent increases for existing renters, prices in BC increased by an average of 4.6% between 2019 and 2021. These vacancy and price trends are consistent across most of the province, particularly in larger municipalities.
Figure 8: Metro Vancouver Rental and Vacancy Rates, 2010-2021
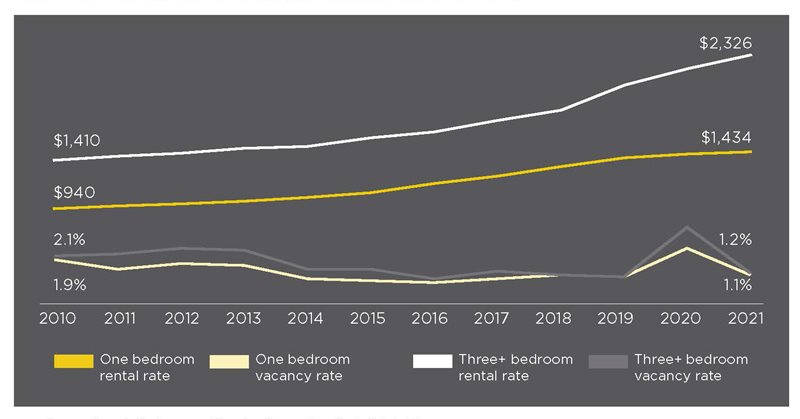
Source: Canada Mortgage and Housing Corporation, Rental Market Survey.
Sluggish income growth
Compounding the housing affordability crisis in BC is the fact that income growth has not kept pace with housing prices.
In 2020, the median after-tax income for a family in BC was $94,300, a gain of 16.9% from 2010.21 For single individuals, the figure was $36,700, marking a more substantial increase of 29.2% over the same period.22 But while there was a significant increase in income for single individuals in 2020, this increase was primarily due to the temporary government supports provided during the pandemic, and not to gains in employment income.
Multi-faceted solutions needed
While population growth slowed in 2020 and the first half of 2021, it is expected that British Columbia will once again become a primary destination for many immigrants, both from other provinces and other countries. This influx is important, as we need these individuals to help our aging population and address the record levels of labour shortages facing businesses in every industry across the province. And as growth from within continues to decline, it will be increasingly important to attract new workers—particularly younger ones—to BC.
However, a growing population will put further pressure on housing demand, and given that housing prices have already reached record levels across the province, serious action must be taken to address the situation. Unchecked, higher housing prices will deter immigrants from coming to BC and push out existing residents, particularly if income growth continues to lag behind.
CPABC housing roundtable discusses potential supply solutions
In November 2021, CPABC gave a presentation to members of the government caucus to provide an overview of the organization and its membership. We highlighted the expertise of CPAs and the fact that members work and provide leadership in every sector, equipped with knowledge and experience that is grounded in their CPA training.
As a result of this discussion, the BC Ministry of Housing contacted CPABC to organize a CPA roundtable discussion on policy options related to housing supply and affordability, which is top of mind for government and recognized as a significant issue for British Columbians in many communities across the province.
Accordingly, CPABC invited a group of senior CPAs from the not-for-profit, public practice, and real estate development and financing sectors to bring their unique perspectives and housing expertise to a discussion with the Honourable David Eby, Attorney General and Minister Responsible for Housing. The roundtable took place on June 21, 2022, with CPABC President and CEO Lori Mathison, FCPA, FCGA, LLB, serving as host. During the discussion, which was held virtually, the invited CPAs helped identify policies to improve BC’s housing supply and affordability, such as:
- Adjusting the planning framework to encourage housing development and reduce the development timeframe;
- Providing financial incentives to create units that are below market-price, and empowering not-for-profit and other organizations to provide more affordable housing;
- Co-ordinating among all levels of government to create cohesive, complementary, and accessible plans that are flexible enough to meet the demands of different kinds of projects; and
- Reforming fees and creating incentives to expedite developments and encourage investment in affordable rental units, mid-sized units, and other sought-after housing units in which investment is currently low.
We’d like to thank the Minister and his office for reaching out to discuss how BC’s housing market can be improved, and the CPABC members who shared their insights with us.
Are you a CPA with expertise in the residential real estate sector? If you’d like to share your thoughts on BC’s housing challenges, contact Aaron Aerts at news@bccpa.ca.
Aaron Aerts is CPABC’s economist.
This article was originally published in the July/August 2022 issue of CPABC in Focus.
Footnotes
1 Aaron Aerts, “Life in British Columbia,” CPABC in Focus, July/August 2021 (12-23).
2 Statistics Canada, “Population Estimates, July 1, by Economic Region, 2016 Boundaries,” accessed May 2, 2022. Population estimates are based on July 1 of a given year.
3 Ibid.
4 Ibid.
5 Statistics Canada, “Table 17-10-0140-01,” accessed May 10, 2022.
6 Statistics Canada, “Table 14-10-0325-01,” accessed May 10, 2022.
7 BC Stats, “Population Estimates & Projections for British Columbia,” accessed May 18, 2022.
8 Statistics Canada, “Table 17-10-0140-01,” accessed May 10, 2022.
9 The Associated Press, “Global Population Growth Slowing Due to Greater Longevity and Lower Fertility Rates,” CBC News, June 17, 2019.
10 Statistics Canada, “Table 17-10-0140-01,” accessed May 10, 2022.
11 Statistics Canada, “Population Projections for Canada (2018 to 2068), Provinces and Territories (2018 to 2043),” September 17, 2019. In the baseline scenarios, natural growth is forecast to become negative.
12 Wolf Depner, “Kelowna Delivering Canada’s Sixth Lowest Fertility Rates,” Kelowna Capital News, May 6, 2022.
14 Robert Hogue, “Hot Canadian Housing Markets Call for a Policy Response,” RBC Economics, March 24, 2021.
15 Scott Stirrett, “Canada’s Ballooning Mortgage Debts Could Put a Dangerous Dent in Entrepreneurship,” Globe and Mail, May 30, 2021.
16 This article was written in spring 2022 (early June).
17 Ian Vandaelle, “RBC Calls Spring Peak for Canadian Housing; Sees Prices Falling in 2023,” BNN Bloomberg, April 21, 2022.
18 Murtaza Haider and Stephen Moranis, Haider-Moranis Bulletin, “Shrinking Condos, Growing Houses: Why Homebuilders Are Increasingly Going to Extremes,” Financial Post, September 11, 2019.
19 Eric Bond and Francis Cortellino, Canada Mortgage and Housing Corporation, Housing Supply Report, May 2022.
20 Ibid.
21 Statistics Canada, “Market income, government transfers, total income, income tax and after-tax income by economic family type,” accessed May 2, 2022.
22 Ibid.


