
A look at BC’s economic performance as we enter the second half of 2026
Author’s note: New estimates from Statistics Canada’s Labour Force Survey show that BC employment increased by 25,200 (+0.9%) in May 2026, reversing some previous losses. The unemployment rate remained unchanged from April at 6.8%.
Despite significant trade challenges and other indicators pointing to potential softness in 2025, British Columbia’s economy maintained respectable growth during the year. Preliminary estimates released in May 2026 showed that BC’s economy grew by 2.0% in 2025, above the national average of 1.6%. BC’s energy sector was a major driver of this growth, expanding by 6.9% during the year due to strength in many parts of the sector (see Table 1). Output from pipeline transportation led the way, increasing by 29.6% in real terms during the Trans Mountain Expansion Project’s first full year of operation.
Another major driver of new economic growth in the province was the LNG Canada terminal in Kitimat, which began shipping liquefied natural gas to Asian markets in 2025. The export facility reached 25 shipments on November 20, 2025,1 and 50 shipments on February 23, 2026.2 Related activities affected BC’s GDP figures in a variety of industries, including pipeline transportation and support activities for transportation.3
More broadly, output from BC’s transportation sector increased by 3.7% in 2025, second only to mining, quarrying, and oil and gas extraction, which increased by 6.2%.4
Table 1: BC Real GDP Growth at Basic Prices, Selected Industries
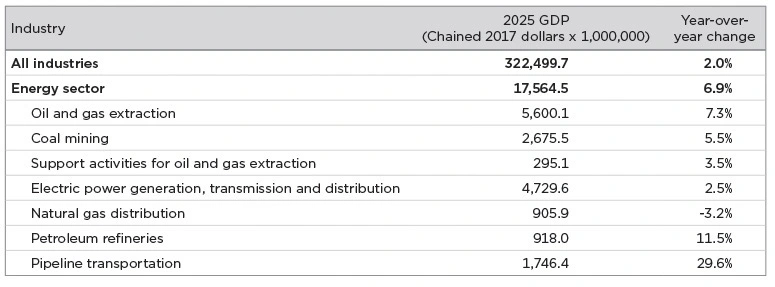
Source: Statistics Canada, Table 36-10-0711-01. Individual components of the Energy sector do not sum to the total, because chained dollar estimates are intended to analyze growth rates only, not shares of economic output.
Growth in the rest of BC’s economy was distributed across sectors, signalling broad resilience; however, there were still some areas of weakness. The ongoing softwood lumber dispute with the United States exacerbated existing challenges by increasing pressure on forestry and downstream industries. As a result, real GDP in forestry and logging fell by 3.0%, and output in both wood product manufacturing and paper manufacturing also declined, dropping by 7.1% and 14.7%, respectively. Overall, manufacturing output decreased by 0.5%.5
Private sector analysts expect BC’s GDP growth to come in near the national average again in 2026, albeit lower, within the 0.4% to 1.2% range.6
Unemployment rate continuing to climb
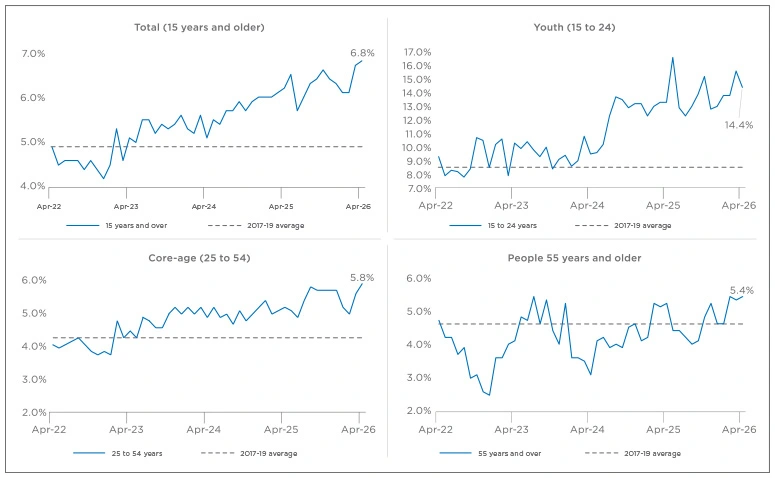
In BC’s labour market, signs of stress have persisted since the beginning of 2026. As of April of this year, BC’s unemployment rate was 6.8%, up 0.5 percentage points from December 2025. This is the highest level seen in more than a decade (excluding the COVID-19 pandemic period).
The downturn in the labour market has not affected all demographic groups equally. Among young people aged 15 to 24, the unemployment rate was 14.4% in April 2026, well above the 2017 to 2019 average of 8.5%. This timing could not have been worse, as many students hope to land a summer job beginning in May. Entering this period with persistently high youth unemployment suggests that students are facing difficult hiring conditions for the second summer in a row (see Figure 1).
Figure 1: Unemployment Rate by Major Age Group in BC, April 2022 to April 2026
Source: Statistics Canada, Table 14-10-0287-01.
Core-working-age adults (aged 25 to 54), who were initially more insulated from the downturn in hiring, are also now finding it more difficult to secure work. Between April 2025 and April 2026, the unemployment rate among this group increased 0.7 percentage points, reaching 5.8%. Similar to the overall rate, this is the highest core-age unemployment rate recorded in BC in over a decade.
While still elevated, the unemployment rate among British Columbians aged 55 and older remained within historical norms. In April 2026, their unemployment rate was 5.4%, effectively unchanged from one year earlier.
Trade and financial services suffered biggest job losses
The increase in unemployment between December 2025 and April 2026 was accompanied by declines in both employment—which fell by 40,200 (-1.4%)—and the labour force, which fell by 29,100 (-0.9%). By comparison, the working-age population declined by 8,500 (-0.2%) during the first four months of 2026.7
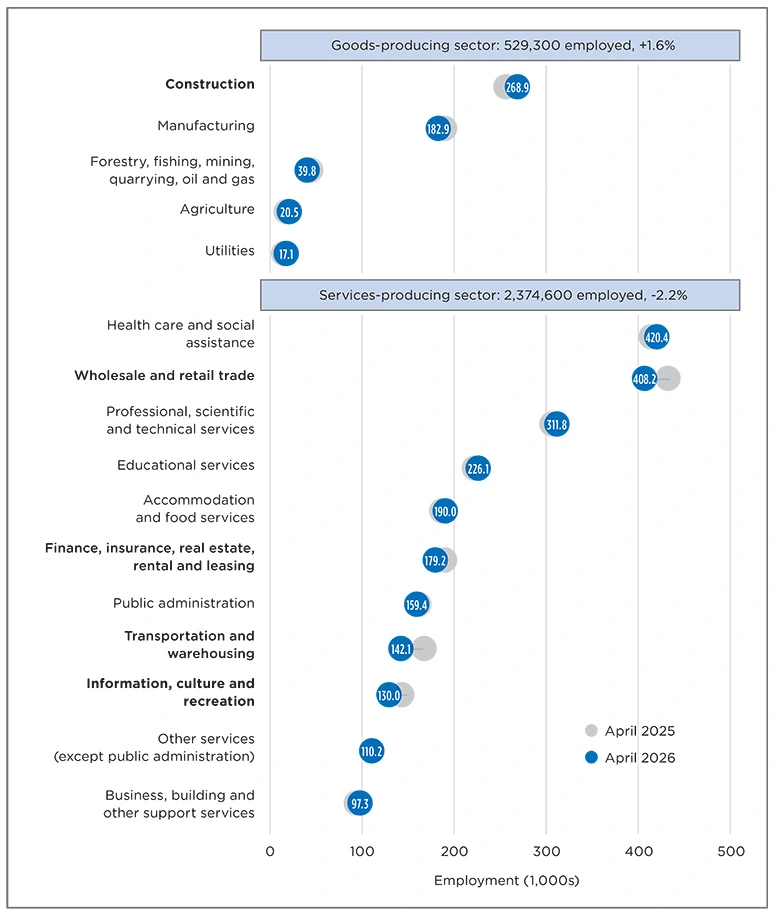
Wholesale and retail trade accounted for half of the net employment decline, as the industry lost 20,500 workers (-4.8%) between December 2025 and April 2026. Employment in finance, insurance, real estate, rental and leasing also declined by 9,200 workers (-4.9%). All other industries experienced only marginal fluctuations.8
Looking at year-over-year figures, employment losses were concentrated in the services sector, which lost 53,100 workers (-2.2%), while goods sector employment rose marginally (see Figure 2). The construction industry added 13,000 workers (+5.1%), while employment in other goods-producing industries changed only slightly.
Figure 2: Employment by Industry, April 2025 to April 2026
Source: Statistics Canada, Table 14-10-0355-01.
Job vacancy rate hovering just above all-time lows
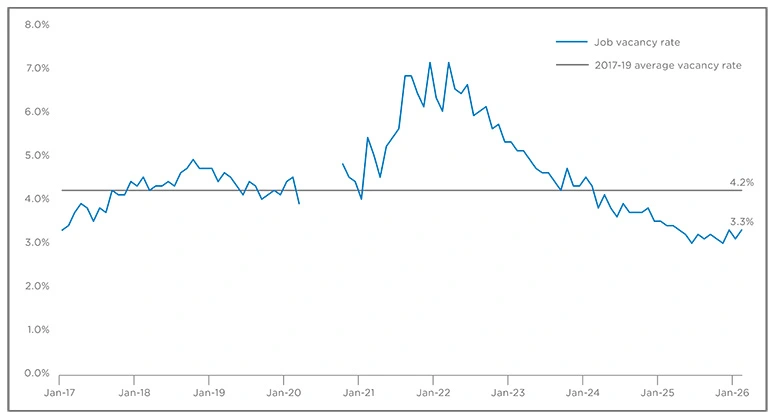
It is important to note that softer conditions have been largely driven by a sustained slowdown in hiring, rather than broad-based layoffs.9 As of February 2026, there were 83,520 job openings in BC, down 3.7% from one year earlier, and the job vacancy rate—the number of vacant positions as a proportion of total labour demand—was 3.3% (see Figure 3).
The job vacancy rate has remained within the 3.0% to 3.4% range for over a year. The lowest rate on record, since data collection began in 2015, is 2.9%.
Figure 3: Job Vacancy Rate in BC, January 2017 to February 2026
Source: Statistics Canada, Table 14-10-0432-01.
Energy supply shock spiking consumer prices
The recent conflict in the Middle East and related disruptions to shipping through the Strait of Hormuz constitute the largest energy-supply shock in history,10 and the impact has started to show up in the data.
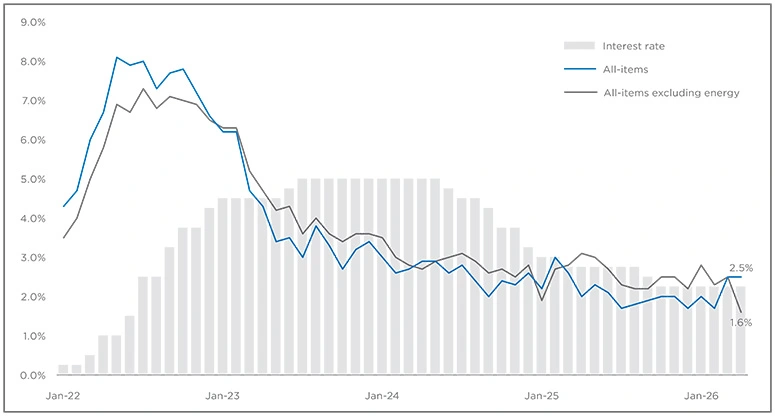
In April 2026, consumer prices in BC increased by 2.5% year-over-year, with energy prices rising by 20.2%. Prices of all goods, excluding energy, rose by 1.6% year-over-year (see Figure 4).
Figure 4: BC CPI Annual Growth and Policy Interest Rate – January 2022 to April 2026
Source: Statistics Canada, Table 18-10-0004-01, and Bank of Canada.
At the national level, headline inflation has held within the Bank of Canada’s (BoC) target range since January 2024. That being said, the bank’s preferred measures of inflation, which remove the most volatile parts of the representative basket of goods, have hovered near the higher end of the BoC’s target range until recently.
In its April 29, 2026, decision to hold interest rates, the BoC noted that there is little evidence, so far, that higher energy prices have spilled over into the prices of other goods and services.11 The longer-term impacts will undoubtedly depend on the timing and nature of a resolution to the conflict, but there is already an indication that global food security could come under pressure as fertilizer prices have doubled since the start of the conflict.
Consumers weathering the storm, but insolvencies increasing
In a recent report,12 Equifax Canada provided a mixed assessment of how Canadian consumers have dealt with the financial strain from higher costs and a slowing labour market. The company found that credit utilization trended lower, as many consumers tightened their belts during the 2025 holiday season, while consumer insolvencies rose to levels not seen since the fallout of the global financial crisis in 2009. Both findings signalled increased stress among those who are most vulnerable to price increases and job loss.
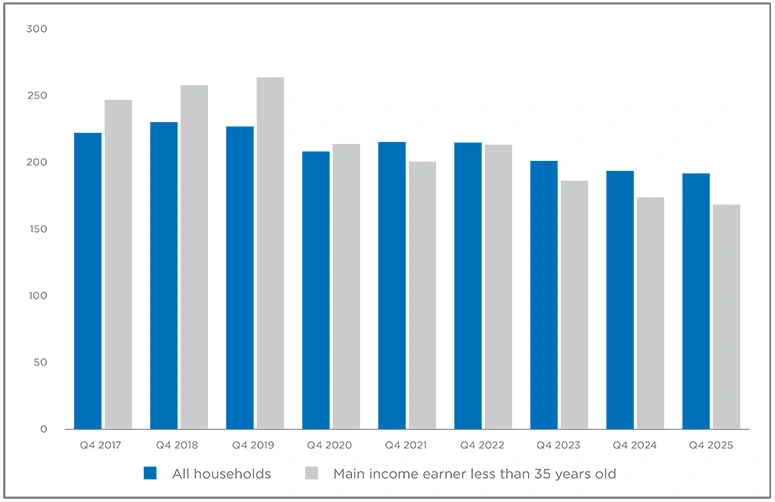
Wealth indicators from Q4 2025 also point to consumers using less credit than they have historically. Across all BC households, the average debt-to-disposable income ratio in Q4 2025 was 190.7%, marking a low point since comparable data became available in 2010. And while the recent decline was more pronounced for the bottom 40% of income earners, it occurred among all age groups. Particularly notable was the drop among households where the main income earner was under 35 years old, as many of these individuals delayed purchasing a home and opted to rent for longer. For this group, the debt-to-disposable-income ratio was 167.5% in Q4 2025, down from 262.3% in 2019 (see Figure 5).
Figure 5: Debt-to-Disposable-Income Ratio among BC Households, 2017 to 2025
Source: Statistics Canada, Table 36-10-0665-01.
Highlighting the importance of tax reform
Incentivized by the volatile geopolitical and economic landscape, politicians at all levels of government have agreed that now is the time to invest in our province—not only for economic prosperity, but also for economic security. As expected, there are differing opinions on the best way to accomplish this goal.
As part of CPABC’s BC Check-Up survey (see page 19 from the July/August 2026 issue of CPABC in Focus for more survey results), members were asked what policy areas the provincial government should prioritize to improve prosperity and productivity. Respondents were given a range of options, and more than half (55%) identified “Establishing a long-term tax reform plan to improve tax competitiveness” as a high priority. “Improving regional economic development” (51%) and “Supporting natural resource projects” (50%) were also assigned a high priority rating by half of respondents.
While progress has certainly been made on the latter two recommendations, BC’s Budget 2026 highlighted the need to address long-term tax reform. Among the new tax measures introduced in the budget was an expansion of the PST base to include a variety of professional services, including accounting and bookkeeping.
In CPABC’s recent submission to the government, we recognized the need to raise government revenue and the political challenges associated with adopting a value-added tax, but added that expanding the PST is still a poor policy choice as it reinforces an inefficient tax system that creates tax cascading, reduces investment, and erodes BC’s competitiveness relative to other jurisdictions.
The bottom line
BC’s economy is enduring a multitude of pressures and challenges, some novel and externally driven (changes to global trade and geopolitical turmoil), some internal and cyclical (a softening labour market), and others that are long-standing structural issues (a complex regulatory environment and weak relative competitiveness). However, there is an obvious appetite to invest in the province, and it’s critical that businesses and all levels of government work together to build a system that reduces barriers to investment and supports sustainable and inclusive prosperity for the benefit of all British Columbians.
Jack Blackwell is CPABC’s economist.
This article was originally published in the July/August 2026 issue of CPABC in Focus.
Footnotes
1 LNG Canada, “Connecting Canadian LNG to the World: 25 Cargoes Achieved,” lngcanada.ca, November 20, 2025.
2 LNG Canada, “Connecting Canadian LNG to the World: 50 Cargoes Achieved,” lngcanada.ca, February 23, 2026.
3 Impact on water transportation is expected to be limited, as most shipments will likely be made by foreign carriers.
4 Statistics Canada, Table 36-10-0711-01.
5 Statistics Canada, Table 36-10-0711-01.
6 These forecasts are from five of Canada’s major banks (BMO, CIBC, RBC, Scotiabank, and TD). Forecasts were made between March and June 2026.
7 BC is in the midst of an unprecedented population reduction due to net outflows of non-permanent residents (NPRs) as federal revisions to immigration and NPR targets take effect.
8 Statistics Canada, Table 14-10-0355-01.
9 Statistics Canada, “Labour Force Survey, April 2026,” The Daily, May 8, 2026. (150.statcan.gc.ca)
10 International Energy Agency, “Oil Market Report,” April 14, 2026. (iea.org)
11 Bank of Canada, “Bank of Canada Maintains Policy Rate at 2¼%,” press release, bankofcanada.ca, April 29, 2026.
12 Equifax Canada, “The Resilient North: Equifax Canada Data Shows Consumers Leaning on Financial Discipline to Offset Macroeconomic Conditions,” press release, equifax.ca. Accessed May 26, 2026.