
CPABC recently released its third and final economic report of 2023: BC Check-Up: Work, which examines emerging trends in the BC labour market such as changes in industry employment and labour force participation. As noted in the 2023 report, persistent inflation and rising interest rates continue to create headwinds for the Canadian economy. These challenges have been one of two main stories for BC over the past year, along with record-high levels of immigration that have helped offset declining labour force participation from an aging population.
Employment growth stalled
Last year’s BC Check-Up: Work report highlighted British Columbia’s strong recovery from the COVID-19 downturn.1 This recovery resulted in an extremely hot labour market; in fact, between March 2022 and February 2023, the province recorded its lowest unemployment rate since 2018, as well as all-time highs in the number of job vacancies and in the participation of the core working-age labour force.23
Table 1: Changes in Select Labour Market Indicators in BC, 2020-2023

Source: Statistics Canada, Table 14-10-0287-01. *Change is not statistically different from the reference period.
Evolving from these incredibly tight conditions in 2022, the BC labour market showed signs of softening in 2023, with muted employment growth relative to the province’s soaring population numbers. BC’s total employment was 2.81 million in September 2023, an increase of 48,300 (+1.7%) since September 2022. Notably, nearly four-hs of the annual increase occurred between July and September, following 10 months of little change in overall employment. The unemployment rate climbed to 5.4% in September 2023, up 1.3 percentage points from the post-pandemic low recorded in December 2022 and up 1.1 percentage points from September 2022. The return of the unemployment rate to pre-pandemic levels coincides with falling levels of unmet labour demand. The job vacancy rate (the number of unfilled positions as a proportion of total labour demand) retreated from record highs to pre-pandemic levels, dropping to 4.3% in July 2023, equal to the 2019 average.4
The labour force participation rate was 65.4% in September 2023, little changed from a year ago and similar to the rate recorded in September 2019. Newcomers to Canada have played an integral role in ensuring that the province maintains a sufficient workforce as the population ages. Over the last four years, the participation rate among Canadianborn citizens fell by 3.3 percentage points, whereas it increased by 3.0 percentage points among landed immigrants and non-permanent residents.5
Population growth soared
One major factor that helped bolster BC’s workforce in spite of economic headwinds was record-high levels of immigration. Between July 1, 2022, and July 1, 2023, BC’s population grew by a record-setting 163,000 as the province welcomed 184,000 (net) international immigrants and non-permanent residents. As a result of this influx, the working-age population grew by 109,700 (+2.5% year over year), and the employment rate dipped slightly to 61.9%. As noted in past issues of CPABC in Focus, the main reason for Ottawa’s aggressive immigration policy is to help support an aging population and replace workers who are retiring or looking to retire soon. It’s a crucial strategy, as, unsurprisingly, we’ve seen an upward trend in the number of new retirements over the last decade. For example, in 2022 alone, more than 40,000 new retirements were recorded in BC, compared to 25,300 in 2012.6
Figure 1: Unemployment Rate and Job Vacancy Rate, 2020-2023
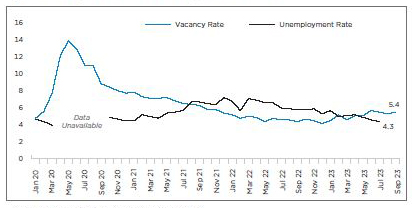
Source: Statistics Canada, Tables 14-10-0287-01 and 14-10-0432-01.
Figure 2: Annual New Retirements in BC, 2002-2022
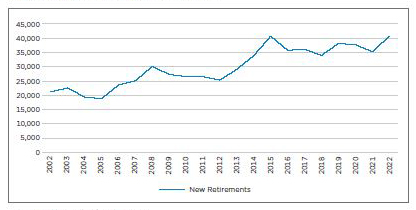
Source: Statistics Canada, Table 14-10-0126-01.
Service-sector growth offset losses in goods-producing industries
The services-producing sector added 65,900 workers (+2.9%) on a year-over-year basis between September 2022 and September 2023, as employment increased in four industries: “Other services,” a category comprised of several industries including household maintenance and civic organizations, collectively added 16,900 workers (+16.6%) to the workforce; education added 13,500 (+ 6.3%); finance, insurance, real estate, rental and leasing added 12,500 (+7.5%); and transportation and warehousing added 10,800 (+7.8%). At the same time, employment in the goods-producing sector fell by almost 18,000 workers (-3.5%), due primarily to a decline in the construction industry, which shrank by 17,700 workers (-7.4%). However, one bright spot for the goods-producing sector was the natural resources industry, which grew by 10.2%, adding 5,100 workers year over year.
In many cases, the shifts in industry employment over the past year were consistent with longer-term trends. Since February 2020, the natural resources industry has experienced the largest proportional growth (+37.0%), followed by education (+29.0%), public administration (+25.0%), and professional, scientific and technical services (+24.8%). Over the same period, business services and construction saw the largest contractions, falling by 21.0% and 15.1%, respectively.
Table 2: Goods Sector – Change (%) in Industry Employment, February 2020 to September 2023
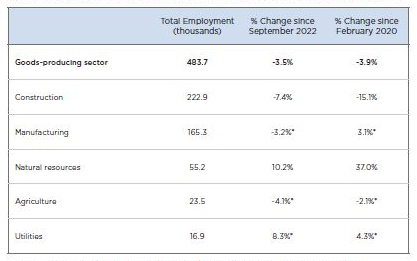
Source: Statistics Canada, Table 14-10-0355-01. Subsectors have been sorted by total employment size as of September 2023. *Change is not statistically different from the reference period.
Table 3: Service Sector – Change (%) in Industry Employment, February 2020 to September 2023
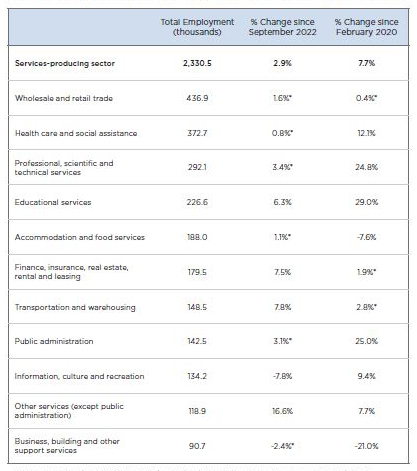
Source: Statistics Canada, Table 14-10-0355-01. Subsectors have been sorted by total employment size as of September 2023. *Change is not statistically dierent from the reference period.
Wage growth remained strong amid slowing but persistent inflation Average wages in British Columbia grew by 7.8% year over year in September 2023, compared to a 3.3% rise in consumer prices over the same period. Women experienced larger wage growth (+9.0%) than their male counterparts (+6.6%).
Despite the fact that 2022 saw inflation reach its highest level in more than 40 years, elevated levels of unmet labour demand and shifts towards higher-wage industries have resulted in an increase in real wages. Since July 2019, the average wage has increased by an annualized rate of 5.4% per year, compared with a 3.5% annualized increase in consumer prices.
Figure 3: Select Price and Wage Indicators, Annualized Change, July 2019 to July 2023
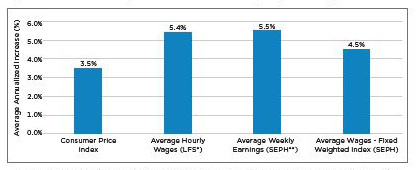
Source: Statistics Canada, Tables 18-10-0004-01, 14-10-0426-01, 14-10-0203-01, and 14-10-0213-01. Data is not adjusted for seasonality. *Labour Force Survey. **Survey of Employment, Payroll and Hours.
What’s in the forecast?
After running particularly hot following the post-pandemic employment recovery, BC’s labour market cooled slightly in 2023, with unemployment and job vacancy rates returning to pre-pandemic levels. Notably, however, these rates remain strong in a historical context, and average wages continue to grow at a formidable pace. The record levels of immigration we’re currently seeing are bolstering employment and mitigating—or perhaps masking—the true effect of economic headwinds. Looking ahead, CPABC will continue to monitor these headwinds and developments in the BC labour market, as the economy is expected to confront both slowing economic growth and flat employment growth in 2024.7
Highlights from CPABC’s BC Check-Up: Work Survey
CPABC’s BC Check-Up survey is conducted three times a year to measure members’ perception of BC as a place in which to work, invest, and live. Nearly 600 CPABC members responded to the most recent survey, BC Check-Up: Work, which was conducted in July and August 2023. We asked members for their thoughts on the economy and the labour market, and here’s what they told us:
On BC’s Economic Outlook
- 29% of respondents rated BC’s economic performance as “excellent” or “good” in August 2023, similar to the percentage recorded in August 2022. The percentage of those who rated it as “poor” was 21%, also similar to last year.
- Perceptions of the Canadian economy overall were slightly worse than the provincial assessment, with only one in five respondents (21%) giving a positive rating. Meanwhile, 26% thought that the Canadian economy was performing poorly.
- 18% indicated that their organization’s prospects improved over the previous 12 months, down six percentage points from April 2023. Almost the same percentage—33%—said prospects worsened, while 48% said they saw no change.
On Employment Trends in BC
- 88% of respondents cited housing prices as the primary constraint on business success in 2023, up nine percentage points from last year.
- 83% cited the ability to attract and retain skilled labour as a major challenge in 2023, while 80% described labour compensation as a challenge; these results were similar to those from last year.
- 39% of senior CPAs said they expect their organization’s workforce to grow over the next year; just 14% said they expect their workforce to contract, virtually the same percentage as in August 2022.
- 40% of senior CPAs said their organization’s turnover rate increased in 2023, down from 47% in August 2022; 13% reported a decrease, up from 6% last year
Survey demographics
Who are they?
598 CPABC members
Where are they from?
Mainland/Southwest BC: 68%
Vancouver Island/Coast: 18%
Thompson-Okanagan: 9%
Rest of BC: 5%
CPABC commissioned Leger Marketing to conduct a web-based survey of CPA members about their impressions of the economy and the labour market. A total of 598 surveys were completed between July 26 and August 18, 2023, representing an overall response rate of 9%. Note: All “don’t know” responses have been excluded from the data in this sidebar. As a result, there may be small discrepancies when comparing this sidebar to infographics published in previous years.
Jack Blackwell is CPABC's economist. This article was originally published in the November/December 2023 issue of CPABC in Focus.
Footnotes
1 Aaron Aerts, “Work in BC – BC Check-Up Work Report Looks at Emerging Employment Trends Amid Economic Turmoil,” CPABC in Focus, November/December 2022 (14-22).
2 As at September 2022.
3 Statistics Canada defines the core working-age labour force as 25-54.
4 Statistics Canada, Table 14-10-0432-01.
5 Refers to three-month moving averages, not seasonally adjusted estimates.
6 Annual new retirements refers to the number of people in the monthly Labour Force Survey who were not working (but had worked within the previous 12 months) and cited “retirement” as the reason for no longer working. The annual figure is a respondent-weighted average of the aggregated monthly results.
7 Beata Caranci, Derek Burleton, Rishi Sondhi, and Marc Ercolao, “Provincial Economic Forecast,” September 20, 2023.


