
CPABC recently released BC Check-Up: Work, its third economic report of 2021.1 In this report, we measure the health of BC’s labour market a year and a half after the province experienced historic job losses due to the COVID-19 pandemic.
The results are mixed. We found that BC’s workforce is now larger than it was before the pandemic due to strong employment gains made over the past year. At the same time, however, our unemployment rate remains relatively high, women are still disproportionately displaced, performance varies across industries, and a labour shortage is looming. So while the resilience of our labour market is encouraging, there are still challenges ahead.
Setting the picture: A positive, albeit uneven, recovery
The COVID-19 pandemic triggered BC’s worst recession since 1982,2 and just weeks after the province entered a state of emergency in March 2020, we went from seeing record high labour shortages to record high employment losses. Over the past year, however, our labour market has experienced a strong recovery, boosted by easing public health restrictions, rising domestic and global demand for goods and services, and historic levels of government fiscal support through measures such as the Canada Emergency Wage Subsidy, which covered a significant portion of eligible worker salaries.
Overall, we’re much better off than we were in August 2020. Back then, BC’s unemployment rate stood at 10.7%, more than double the rate of August 2019, and 170,000 fewer people were employed, signifying an employment decline of nearly 7%. Moreover, the average hours worked were down 12% from the previous summer.
By August 2021, however, we’d made significant strides, with employment reaching 2.67 million, signifying a net gain of more than 200,000 jobs over the previous year.
Employment up but hours down
Part-time positions led in BC’s recovery process, increasing by 8.5% between August 2020 and August 2021 (see Table 1).
Table 1: Changes in Population and Employment in BC, 2019-2021
| Category | August 2019 | August 2020 | August 2021 | % change since 2019 | % change since 2020 |
|---|---|---|---|---|---|
| Population | 4,253,000 | 4,307,000 | 4,358,000 | 2.5% | 1.2% |
| Full-time employment | 2,080,000 | 1,920,000 | 2,075,000 | -0.3% | 8.0% |
| Part-time employment | 584,000 | 548,000 | 595,000 | 1.8% | 8.5% |
| Total hours worked | 82,789,000 | 73,029,000 | 81,801,000 | -1.2% | 12.0% |
| Unemployment rate | 5.0% | 10.7% | 6.2% | 24.0% | 42.1% |
Source: Statistics Canada, Tables 14-10-0036-01 and 14-10-0287-01. Rounded to the nearest 1,000.
This is hardly surprising, given that industries with high numbers of part-time employees—such as hospitality—were the ones hardest hit by business restrictions and closures in the early days of the pandemic. In fact, nearly a third of BC’s part-time positions were eliminated between March and June 2020 (see Figure 1), so a rebound was to be expected.
Figure 1: Part-Time and Full-Time Employment in BC, 2019-2021
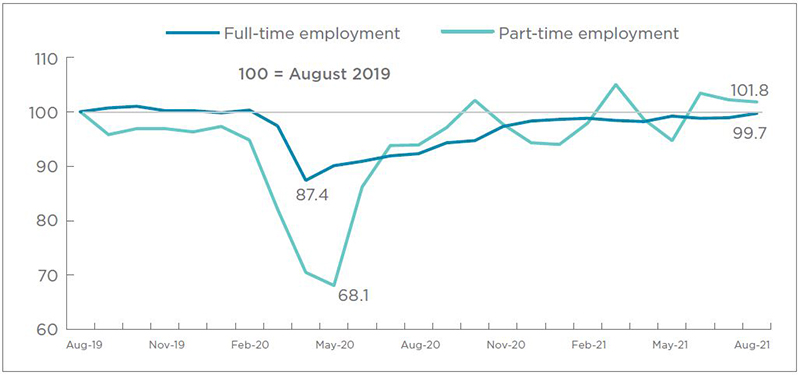
Source: Statistics Canada, Table 14-10-0287-01.
We’ve also seen a tremendous recovery in part-time positions because of a larger shift away from full-time work in a variety of sectors, which is reflected in the number of full-time positions and the total number of hours worked. Despite consistent growth over the past year, BC had fewer full-time positions and nearly one million fewer work hours in August 2021 (81.8 million) than in August 2019. So while overall employment is up, the average position offers fewer hours of work.
Population growth and other challenges
The unevenness of BC’s employment recovery is also clear from the significant gap between population growth and employment growth over the past two years.
Despite a slowdown in immigration in 2020, the province’s working-age population grew by 105,000 between August 2019 and August 2021 (see Table 1). This growth far exceeded the net gain of 5,000 jobs over the same period, which helps explain why a large number of British Columbians remained out of the workforce despite employment gains. In fact, this significant gap is the primary reason why our unemployment rate remained relatively high.
Of course, it’s important to put BC’s employment rate in context. Prior to the recession in 2020, the province’s labour market had been tightening for many years, leading to record lows in unemployment in 2018 and 2019 (see Figure 2). In fact, throughout 2019, BC’s average monthly unemployment rate stood at 4.7%, down from an average of 7.6% in 2010. So although BC’s unemployment rate of 6.2% in August 2021 was higher than the 5.0% recorded in August 2019, it was actually a marked improvement over the previous year, when unemployment stood at 10.7%.
What kept us from dropping to the record low unemployment rates of 2019 was a 24.3% increase in the number of BC residents (more than 34,000) who were actively seeking employment but unable to find it.
Figure 2: Unemployment Rate by Gender, 2000-2021
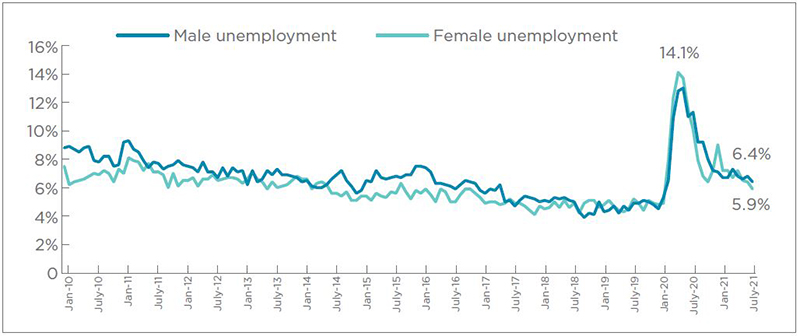
Source: Statistics Canada, Table 14-10-0287-01.
Women in the labour force—what the data reveals
After initially spiking in the early days of the pandemic, the unemployment rate for women in BC dropped to 5.9% in August 2021, below the rate of 6.4% for their male counterparts. While this would seem to suggest that employment was more robust for women than men in BC over the past year, it more accurately reflects a significant increase in the number of women who left the labour force.
Notably, the labour participation rate for women was 1.4 percentage points lower in August 2021 than in August 2019, dropping to 60.7%, meaning that approximately six in every 10 women aged 15 and older were employed or actively seeking employment. By contrast, the labour participation rate for men in BC was nearly 10 percentage points higher in August 2021, reaching 70.1%, which marked a slight increase from August 2019.
The lower participation rate of women in the labour force has created a smaller pool of potential workers, and it’s another reason businesses have struggled to find employees in 2021.
Figure 3: Labour Participation Rate by Gender, 2019-2021
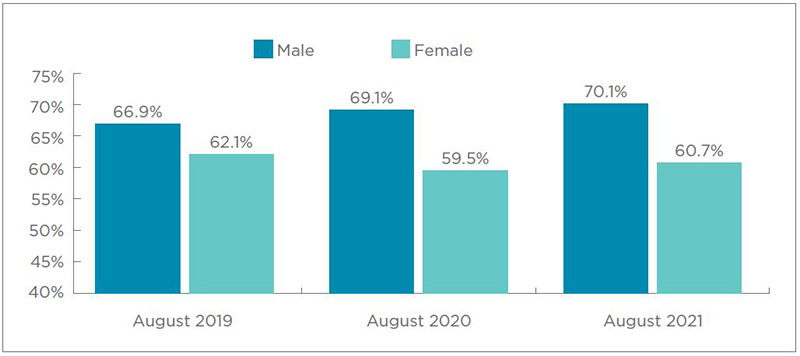
Source: Statistics Canada, Table 14-10-0287-01.
While no one factor alone accounts for the decline in women’s labour force participation, household responsibilities, such as childcare, have been a significant factor during the pandemic.3 In addition, industries that typically employ more women than men—such as hospitality—have struggled more during the pandemic.
Several other employment indicators illustrate the disproportionate impact of the COVID-19 recession on women. For example, women’s total number of work hours dropped by 2.5% between August 2019 and August 21 (see Table 2), whereas men’s work hours fell by just 0.2% over the same period.
Similarly, full-time employment for women fell by 2.2% between August 2019 and August 2021, while men’s full-time employment actually increased by 1.2% over the same period. Additionally, approximately two-thirds of BC’s part-time jobs were held by women in August 2021, while men occupied well over half (57.5%) of the province’s full-time positions.
Table 2: Changes in BC Employment Data by Gender, August 2019 to August 2021
| Employment type | August 2019 | August 2020 | August 2021 | % change since 2019 | % change since 2020 |
|---|---|---|---|---|---|
| Total hours worked - Males | 47,919,000 | 42,738,000 | 47,805,000 | -0.2% | 11.9% |
| Total hours worked - Females | 34,870,000 | 30,292,000 | 33,995,000 | -2.5% | 12.2% |
| Full-time employment - Males | 1,179,000 | 1,101,000 | 1,193,000 | 1.2% | 8.4% |
| Full-time employment - Females | 902,000 | 819,000 | 882,000 | -2.2% | 7.6% |
| Part-time employment - Males | 211,000 | 194,000 | 209,000 | -0.7% | 7.8% |
| Part-time employment - Females | 374,000 | 354,000 | 386,000 | 3.2% | 8.9% |
Source: Statistics Canada, Table 14-10-0287-01.
The data tells us not only that more women than men transitioned out of the labour force over the past year, but also that women who remained in the workforce took on comparatively more part-time work and/or were more likely to experience reduced work hours.
Big gains—and big variations—in the service sector
As noted earlier, job losses were heaviest in the service sector, particularly early in the pandemic, as physical distancing restrictions forced many businesses to either scale back or shut down. Between January and April of 2020—April being the lowest point—employment in BC’s service sector fell by 16.7%, a loss of 357,000 jobs or approximately one in every six positions.
Recovery in the service sector has been equally dramatic. In August 2021, the service sector employed 2.18 million people across the province, signifying a 10.4% increase from August 2020 numbers. Overall employment in this sector also surpassed pre-pandemic levels, increasing by 1.1% (or 23,500 jobs) between August 2019 and August 2021 (see Table 3).
However, the recovery varied greatly by subsector over this period, with some service industries experiencing significant gains as others continued to struggle.
Gains were strongest in the public sector, and particularly in the health care and social assistance subsector, where jobs increased by 12.9% between August 2019 and August 2021. Public administration (+10.6%); professional, scientific, and technical services (+10.4%); and finance, insurance, real estate, and leasing (+3.4%) were the only other subsectors to make job gains over this same period. By contrast, subsectors that required regular in-person interaction—such as education; information, culture, and recreation; and accommodation and food services (hospitality)—saw the biggest losses between August 2019 and August 2021.
Over the past year, however, every service industry saw positive employment growth, with the exception of hospitality. The information, culture, and recreation subsector was the biggest winner between August 2020 and August 2021, with its workforce expanding by nearly 29.9%. These gains were driven by a growing demand for labour in the film and television production industry.
Table 3: Service Sector Employment by Subsector, August 2021*
| Subsector | Total employment (in 1,000s) | % change from August 2019 | % change from August 2020 |
|---|---|---|---|
| Total service-producing sector | 2,182.7 | 1.1% | 10.4% |
| Health care and social assistance | 376.2 | 12.9% | 16.3% |
| Public administration | 132.5 | 10.6% | 12.3% |
| Professional, scientific, and technical services | 258.2 | 10.4% | 14.5% |
| Finance, insurance, real estate, rental and leasing | 169.9 | 3.4% | 5.7% |
| Wholesale and retail trade | 403.6 | -0.1% | 8.3% |
| Transportation and warehousing | 139.7 | -0.4% | 3.9% |
| Accommodation and food services | 184.9 | -5.3% | -0.1% |
| Business, building, and other support services | 105.4 | -6.9% | 18.4% |
| Educational services | 177.0 | -7.8% | 7.1% |
| Information, culture, and recreation | 126.4 | -8.4% | 29.9% |
| Other services (except public administration) | 108.8 | -13.1% | 3.2% |
Source: Statistics Canada, Table 14-10-0355-01. *Subsectors have been sorted from best to worst, per percentage change since 2019.
Challenges in the goods sector
As the service sector improved over the past year, the goods sector saw its workforce erode. In August 2021, the goods sector employed 486,900 individuals, marking a 0.9% decline from August 2020. This decline was primarily due to a decrease in agriculture and construction employment.
Challenges in the construction industry (the largest employer in BC’s goods sector) have had a particularly significant impact over the past two years. Since August 2019, more than one in every 10 construction workers has lost work, equivalent to a loss of 27,100 construction jobs. These losses were driven by a decline in real estate investment in the wake of the pandemic,4 and they’re the primary reason employment in the goods sector dropped by 3.6% between August 2019 and August 2021.
There were some bright spots for the goods sector, however, as strength in commodity prices helped bolster employment in both the natural resources and manufacturing industries. In fact, in August 2021, employment in these industries exceeded August 2019 levels by 6.6% and 6.3%, respectively (see Table 4).
Table 4: Goods Sector Employment by Subsector, August 2021*
| Subsector | Total employment (in 1,000s) | % change from August 2019 | % change from August 2020 |
|---|---|---|---|
| Total goods-producing sector | 486.9 | -3.6% | -0.9% |
| Utilities | 18.1 | 36.1% | -18.5% |
| Forestry, fishing, mining, quarrying, oil and gas [natural resources] | 50.2 | 6.6% | 10.6% |
| Manufacturing | 180.3 | 6.3% | 8.9% |
| Construction | 219.5 | -11.0% | -2.0% |
| Agriculture | 18.9 | -34.1% | -45.4% |
Source: Statistics Canada, Table 14-10-0355-01. *Subsectors have been sorted from best to worst, per percentage change since 2019.
Concerns increase as labour market tightens
To better assess BC’s labour market and economic outlook, we surveyed CPABC members in July and August 2021 (see page ## for more survey highlights).5 When asked about the overall state of the provincial economy, 77% said it was in “average” or “good” shape in 2021, an increase of 21 percentage points from our 2020 survey results. At the same time, however, nearly 78% said the ability to attract and retain labour was a major challenge to the success of business in BC.
The labour challenge was also identified in a recent study conducted by the Business Development Bank of Canada (BDC). In its ensuing report, How to Adapt to the Labour Shortage Situation,6 the BDC notes that the labour shortage BC was facing prior to the pandemic has only intensified as employment has surpassed pre-pandemic levels. In fact, 64% of entrepreneurs who responded to the BDC study indicated that labour shortages were limiting their growth, and they identified a lack of job candidates (45%) and a lack of suitable skills (44%) as their biggest hiring constraints.
The growing challenge of finding right-skilled workers is also reflected in the rising number of job vacancies in BC. Already on the rise prior to the pandemic, job vacancies only continued to increase between the fourth quarter of 2020 and the second quarter of 2021. Notably, the job vacancy rate of 5.4% in the second quarter of 2021, which represents more than 122,000 jobs, is significantly higher than the job vacancy rate in the second quarter of 2019 of 4.6%.
Figure 4: BC Job Vacancy Rate, 2017-2021
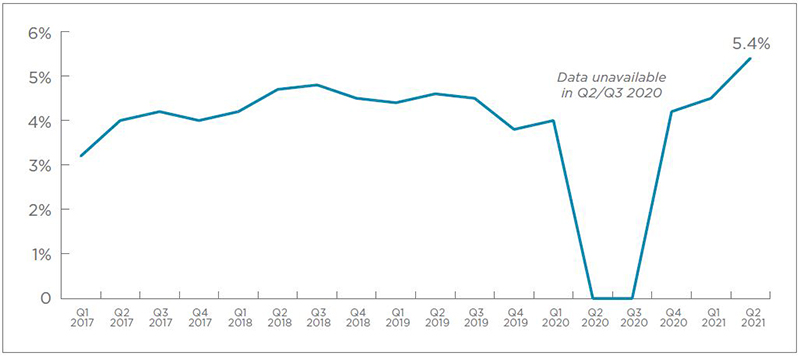
Source: Statistics Canada, Table 14-10-0325-01.
A bright but cloudy outlook
British Columbia’s workforce has shown tremendous resilience in its ability to rebound from the early days of the economic downturn in 2020. The fact that employment levels now exceed pre-pandemic levels is a clear sign that the economic downturn did not fundamentally alter our employment outlook. In fact, most private forecasters anticipate that BC’s unemployment rate will return to pre-pandemic levels over the next few years.7
However, the headline data masks some underlying challenges, including a prolonged decline in women’s labour participation and wide variations in industry performance. Further, the growing labour shortage is expected to put downward pressure on the province’s economic outlook.
As we continue on the road to economic recovery, it is critical that we approach these labour challenges thoughtfully. For instance, we need to implement policies such as skills training to help British Columbians who remain unable to find work, with a particular focus on those industries facing the greatest scarcity of labour. We also need to carefully consider barriers to joining the labour force, such as the lack of accessible and/or affordable childcare.
While the worst of the economic consequences from the pandemic may be behind us, it is now time to take meaningful action to ensure that we set businesses and workers up for renewed success.
Aaron Aerts is CPABC’s economist. This article was originally published in the November/December 2021 issue of CPABC in Focus.


