
New report provides insights on COVID-19 employment disruption
CPABC recently launched its first report in a triannual series on the way British Columbians live, work, and invest. The report, BC Check-Up: Work, focuses on how the shutdown of businesses across the province continues to disrupt the employment of hundreds of thousands of individuals, with some groups, industries, and regions disproportionately damaged.
More than one-in-10 British Columbia job seekers unable to find employment
After years of tightening labour market conditions in BC, the trend reversed abruptly in 2020 as a result of the COVID-19 pandemic.1 While we saw a recovery from April lows as businesses began to reopen and government support came into effect, many formerly employed individuals have struggled to return to their previous positions, and new entrants have found few opportunities.
In August 2020, BC’s unemployment rate stood at 10.7%, more than double the rate from August 2019 (see Table 1), and 170,000 fewer people were employed, signifying an employment decline of nearly 7%. Adding to the employment challenge is the fact that full-time positions have been lost at twice the rate of part-time positions, and many businesses have had to reduce hours of operation and employee work hours to help reduce costs.2 Combined, these factors drove the average hours worked in the province down by more than 12% in August 2020 compared to August 2019, highlighting the sizable gap that must be closed to bring the economy back to its pre-pandemic capacity.
Table 1: British Columbia Employment Statistics
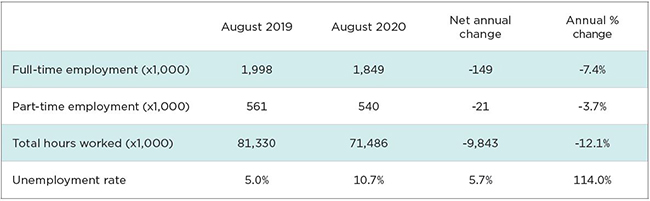
Source: Statistics Canada, Table 14-10-0287-01. Seasonally adjusted.
Job loss concentrated among women and youth
The report indicates that some demographic groups have a particularly challenging road ahead, as declines in employment have been unevenly distributed. Early on in the pandemic, for example, the resultant recession was deemed a “she-cession” due to its disproportionate impact on women’s employment.3 This was largely the result of two factors: First, service industries with a higher concentration of female workers were hardest hit by the pandemic; second, women were more likely to take on additional household responsibilities through the crisis.
Figure 1: Women’s Employment Rate, 10-Year Trend
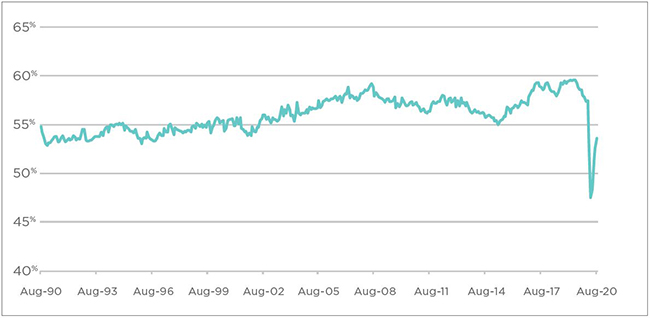
Source: Statistics Canada, Table 14-10-0287-01. Seasonally adjusted.
While BC saw some progress in women’s employment through early summer, by August the number of women employed in full-time positions was still 9.4% lower than in August 2019, almost double the decline in full-time positions for men. Further, the crisis has undone decades of increased employment rates for women, with only 53.6% of women working in August 2020—a level not witnessed since the early 1990s (see Figure 1).
The other cohort most severely affected by the economic crisis is the next generation of workers. Young workers between the ages of 15 and 24 are experiencing historically high unemployment rates, with nearly one in every four young job seekers unable to secure employment in August 2020 (see Figure 2). The youth unemployment rate was almost three times higher than that of other age groups, dragging up the unemployment rate overall. While the situation has improved from a peak of almost 30% in June, the youth unemployment rate remains higher than any level seen in the last 35 years.
Figure 2: Unemployment Rate by Age Group, August 2019 versus August 2020
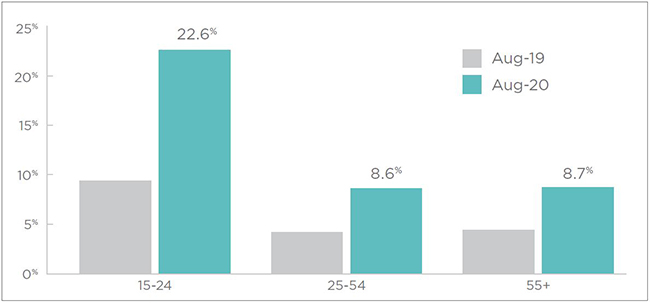
Source: Statistics Canada, Table 14-10-0287-01. Seasonally adjusted.
As with women’s employment, the sizable impact on youth employment can be partly explained by the significant declines experienced in the service sector, where young workers are also more likely to be employed.
Service sector industries relying on tourism and high density now make up bulk of employment losses
The COVID-19 pandemic has devastated industries that require high density, close interaction, and tourism/travel—prerequisites for much of the service sector. While innovative changes to business models (such as increased digital offerings and alterations of physical space) have helped, job losses in the service sector have continued to drive job losses overall. In fact, there were 157,000 fewer service sector jobs in August 2020 compared to August 2019, accounting for more than 90% of total job losses.
The situation remains especially dire for the following service industries, which experienced the largest job declines in August (see Table 2):
- Information, culture, and recreation, which relies heavily on tourism and high-density environments.
- Business and building support services, which has been hit hard by business closures and the widespread transition to remote work.
- Other services, which includes employment in household and personal services; these are largely discretionary and often require close human interaction.
Table 2: Service Sector Employment Change – Three Largest Subsector Declines, August 2020 versus August 2019
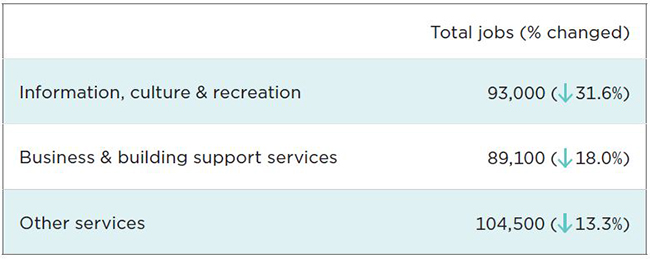
Source: Statistics Canada, Table 14-10-0355-01. Seasonally adjusted.
While employment losses were concentrated in the service sector, the pandemic has also affected employment in the goods sector by putting pressure on major capital investments and reducing global demand for commodities. In August 2020, employment was down 8.3% year-over-year for construction, down 7.6% for natural resources, and down 1.4% for manufacturing.
Regional employment trends in the age of COVID-19
The report also examines employment in each of BC’s development regions, comparing conditions in summer 2020 (June to August) to conditions in 2019, and indicates that each region’s workforce faced unique challenges in navigating the crisis. What follows is a high-level summary—see LINK the full report for a more comprehensive snapshot of each region, including details on the industries that experienced the largest employment shifts.
Mainland/Southwest hit by highest unemployment rate in BC
While no region was left unscathed by the COVID-19 pandemic, there were significant disparities across the province (see Table 3). The Mainland/Southwest BC region (Southwest BC)—previously home to one of the strongest labour markets in the country—had BC’s highest summer unemployment rate at 12.3%, more than two-and-a-half times higher than the rate in the summer of 2019. This was in large part due to the region’s heavy reliance on employment in service industries, particularly in customer-facing and business/office building support industries. Rounding out the second- and third-highest regional unemployment rates were the Northwest (North Coast and Nechako) and Kootenay regions, at 12.2% and 11.3%, respectively.
Table 3: Unemployment Rate by Development Region

*ppt = percentage point.
Source: Statistics Canada, Table 14-10-0293-02, unadjusted for seasonality. Moving three-month average.
Northern BC sees largest relative employment declines
One challenge of the unemployment rate is that the crisis created sizable shifts in regional labour conditions, such as participation rates, which can distort the unemployment rate and make comparisons more challenging. As such, it is important to consider other indicators, such as the relative decline in employment by region (see Table 4).
Overall, the Northwest region saw the steepest relative job decline, with employment down by 12.2% compared to last summer. Job losses were led by declines in the hospitality sector as tourism dried up and the natural resource sector as global demand and commodity prices weakened. Despite some part-time job gains, the Cariboo region had the second-highest loss of full-time jobs, also due to hospitality and natural resource displacement. Northeast BC was third in full-time job losses, as construction jobs declined more than 50% despite ongoing work on Site C.
Table 4: Full-Time and Part-Time Employment by Development Region, August 2020 versus August 2019
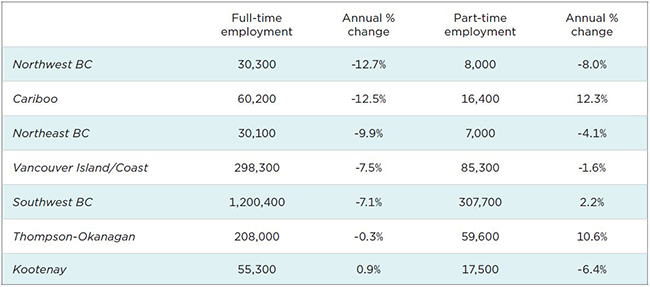
Source: Statistics Canada, Table 14-10-0293-02, unadjusted for seasonality. Moving three-month average.
BC employment expected to improve but remain relatively weak
It may take years for many of the positions lost during this crisis to return, and some may disappear entirely. As a result, although BC’s unemployment rate is forecast to gradually decrease, it will likely remain higher than the province’s historical average. According to the BC Government’s September fiscal update, BC’s overall unemployment rate in 2020 is forecast to be 10.4% before declining to 8.8% in 2021.4 While this would signify an improvement, 8.8% is still almost double the pre-pandemic unemployment rate, which indicates that it will take several years for the province to recover from the COVID-19 pandemic. Going forward, it will be critical for governments at all levels to identify those most affected and find solutions to support them in finding employment.
Aaron Aerts is CPABC’s economist, external affairs & communications department.
Originally appeared in the November/December 2020 issue of CPABC in Focus.


